This is a technical operations summary, focused on being accessible and practical. It also serves as a periodic reflection on PostgreSQL database operations. Hope it helps fellow PGers.
Previous ops experience: PostgreSQL Operations Experience 2024. Note: this article does not repeat content from that one.
CPU#
SQL performance problems are the most common root cause in PostgreSQL incident handling. This includes poor SQL performance, suboptimal indexing, sudden high concurrency, and execution plan regressions. For a database like PostgreSQL that lacks a robust plan-binding mechanism, having a DBA team to help design data models, access patterns, indexes, and tune execution plans is crucial — it can significantly reduce sudden CPU saturation incidents.
Execution Plans#
Execution plan instability is an age-old problem with cost-based optimizers, and PostgreSQL is no exception.
Inaccurate DISTINCT Estimates#
Case Study: From Inaccurate DISTINCT to DISTINCT Calculation Principles
The default maximum sample size is 30,000 rows. For tables exceeding this size, the estimated distinct count is likely to be low. Note: this assumes the data doesn’t have too many unique values.
Testing on a table with different sample sizes:
Table: reltuples=800 million, relpages=20 million, size=175GB, actual distinct on the target column: 100 million.
| target statistics | pages sampling rate | tuples sampling rate | n_distinct | execution time |
|---|---|---|---|---|
| 50 | 0.00075 | 0.00001875 | 60K | 2s |
| 100 | 0.0015 | 0.0000375 | 110K | 5s |
| 1000 | 0.015 | 0.000375 | 1.03M | 58s |
| 3000 | 0.045 | 0.001125 | 2.68M | 3m01s |
| 10000 | 0.15 | 0.00375 | 6.75M | 7m21s |
(target statistics max value: 10000)
Rough summary: n_distinct and analyze execution time grow proportionally with sample size.
n_distinct increases with sample size, while pages and tuples estimates remain consistently accurate.
Generic Plan Interference#
PostgreSQL execution plans must account for generic plans. A generic plan is parameter-independent — it uses default values to compute cost, then compares against the first five custom plan costs; whichever is cheaper wins.
Case Study: Adding an Index Causes Performance Degradation and Generic Plans
I. Classification of generic plan estimation problems
Because of the 5-execution comparison mechanism, generic plan problems fall into two categories:
- The first 5 SQL executions are not representative. Heavily dependent on data skew and whether the first 5 parameter values are representative.
- The generic plan itself is flawed. Due to data skew or inability to accurately compute selectivity even with balanced data, the generic plan is inherently inefficient.
II. Solution reference
Generic plan problems often surface on partitioned tables. When the partition key is continuous, scanning all partitions should yield a selectivity of 1, but the generic plan estimates 0.05 — likely resulting in a “full index scan” scenario.
Consider these when optimizing:
- Don’t create too many indexes that confuse the optimizer
- Eliminate generic plan interference. Execute the prepared statement 6 times for real
- Compare plans with session-level
set plan_cache_mode='force_generic_plan';orset plan_cache_mode='force_custom_plan';; or on PG 16+, useexplain (GENERIC_PLAN)to compare
Syntax reference:
--prepare/execute
PREPARE sql1(text) AS
SELECT COUNT(*) FROM LZL where a=$1;

EXECUTE sql1('zzz');  --run 6 times first
EXPLAIN EXECUTE sql1('zzz');

select * from pg_prepared_statements --view prepared statement info, current session only

--Compare execution plans, set session parameter then EXPLAIN EXECUTE
set plan_cache_mode='force_generic_plan'
set plan_cache_mode='force_custom_plan'
--Directly view generic plan, 16+
explain (GENERIC_PLAN) xx
LWLock:Lockmanager Caused by Row Locks#
LWLock Lockmanager issues typically occur on partitioned tables under high concurrency with queries lacking partition keys. This year, a new scenario was discovered: Row Locks Causing LWLock:Lockmanager
This isn’t a major issue — blocking on concurrent updates to the same row is well known. I just hadn’t expected that updating the same row could also produce LWLock:Lockmanager. Not a particularly valuable case study, but when you see LWLock:Lockmanager as a wait event, consider row locks.
Idle Connections#
PostgreSQL performance generally improves with each major release. PG 14 made significant optimizations to snapshot acquisition and backend transaction tracking, yielding noticeable improvements for high idle connection counts:
 (
(However, this doesn’t mean you can ignore idle connections after PG 14. They still consume backend transaction maintenance overhead, cause context switches, fragment memory, etc. — the more idle connections, the worse the performance.
Typically, application connections have keepalive and pooling. Maintaining some idle connections avoids creating new connections for every request, which would be far more expensive. Small databases generally don’t need to worry much about connection counts (as long as they’re not absurd) — CPUs are cheap, the system isn’t critical, and scaling is easy. But large databases are different. CPU count is the hard limit; you can’t just add more. Large databases already have many idle connections; adding more doesn’t necessarily increase throughput — when CPU is already tight, it can backfire.
PG 15 benchmark experience: with 5K idle as baseline, increasing to 10K idle adds ~2-5 vCPU overhead for idle maintenance; 20K idle adds ~5-10 vCPU. Approximate.
Idle in Transaction#
Last year I thoroughly criticized long transactions, because they impact PostgreSQL more severely than other databases (Oracle, MySQL, etc.). But this is manageable — with proper alerting and operations, long transactions are solvable.
When monitoring session states, you need to check them. active means running SQL, idle in transaction means in a transaction but not currently executing SQL. All pg_stat_activity states, PG 15:
Current overall state of this backend. Possible values are:
active: The backend is executing a query.idle: The backend is waiting for a new client command.idle in transaction: The backend is in a transaction, but is not currently executing a query.idle in transaction (aborted): This state is similar toidle in transaction, except one of the statements in the transaction caused an error.fastpath function call: The backend is executing a fast-path function.disabled: This state is reported if track_activities is disabled in this backend.
Common states are: active, idle, idle in transaction, idle in transaction (aborted). A common misconception about idle in transaction: it only means no SQL is running right now and the transaction hasn’t committed — it does NOT mean the transaction has been idle for a long time. Don’t use xact_start + idle in transaction to judge how long a transaction has been idle. Use state_change + idle in transaction instead.
Memory#
Memory issues are extremely tricky, and I handled many this year, finding some good solutions. But memory knowledge is broad — I’ll try to simplify as much as possible, going straight to symptoms, results, and solutions.
Memory Issues and Huge Pages#
Classification of PostgreSQL memory problems:
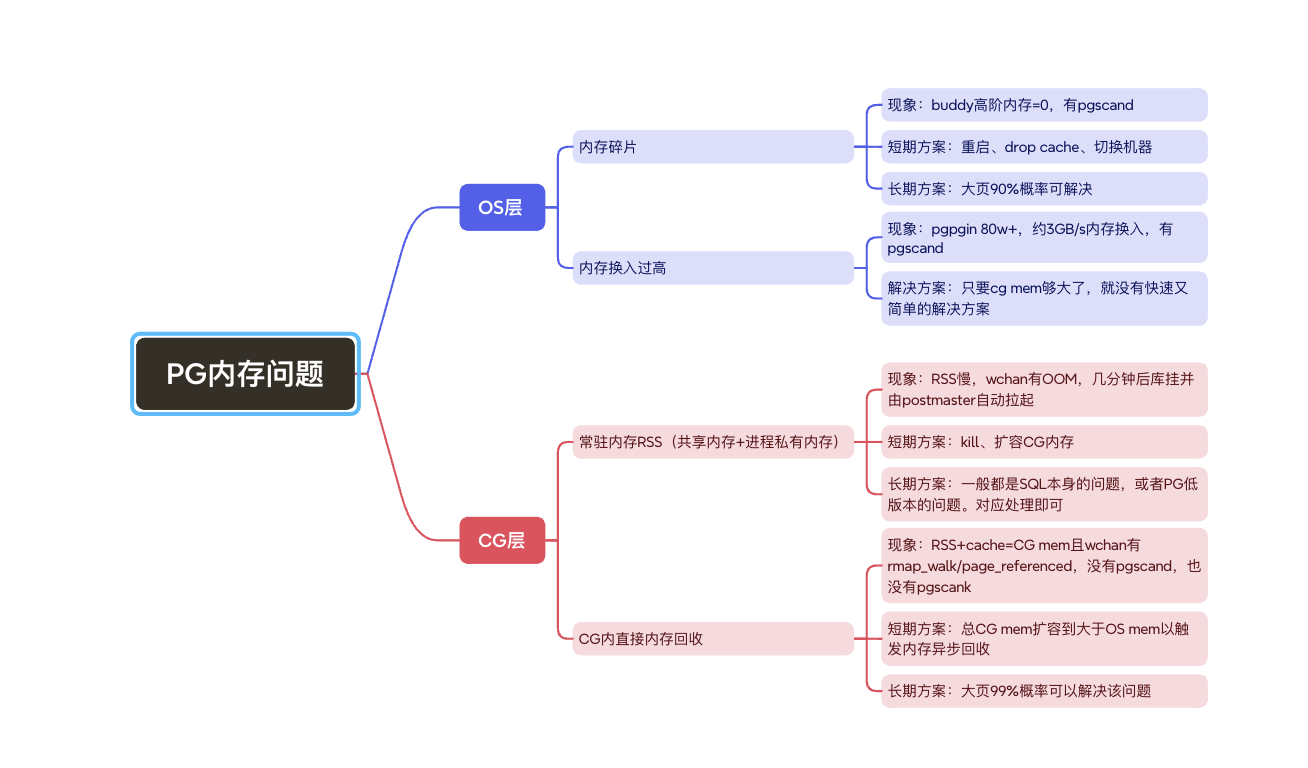
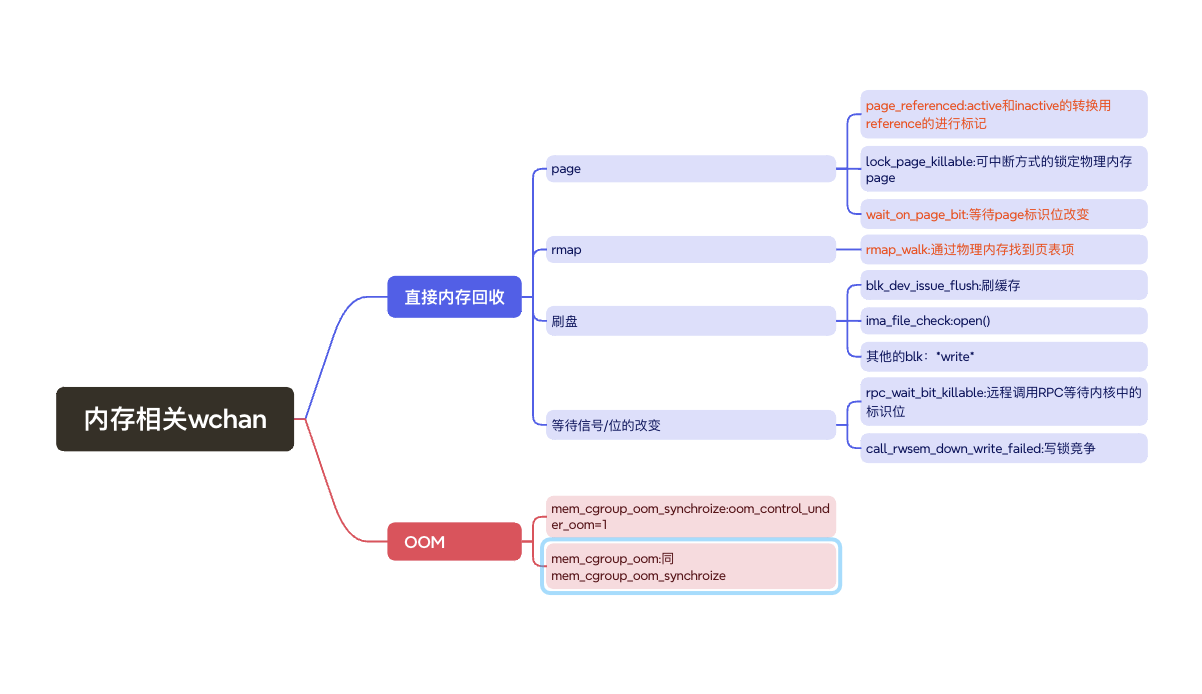
Relevant wchan states for PG memory issues:
Huge pages are very effective against memory fragmentation and direct memory reclaim within cgroups.
Benchmark results for huge pages: https://docs.paic.com.cn/#/post/84479375
Theoretical benefits of huge pages:
- Reduced TLB pressure
- Reduced page table size in main memory
- Huge pages are physically contiguous. Contiguous physical memory access is better than non-contiguous
- With huge pages, pages are directly mapped without multi-level PTE entries
However, huge pages bring management challenges:
- Must pre-allocate huge pages
- Must calculate huge page size in advance to avoid memory waste
Memory knowledge is extensive. For more, refer to Advanced Linux Memory. Key takeaways:
- Rule out OS-level issues before tackling PG instance-level issues
- Huge pages have remarkable effects, but in rare cases they don’t help
- Many people don’t monitor pgpgin/pgpgout/pgfree, or even pgscank/pgscand — they only look at CPU and memory usage. That’s insufficient for operating PostgreSQL.
- Without good operational practices, PG memory can be very unstable
Notable Cgroup Knowledge#
Cgroup knowledge is also extensive. Refer to earlier articles; here’s a quick summary.
Cgroup v1 has inherent flaws:
- Does not account for cgroup page tables
- Does not account for cgroup slab
- Does not account for cgroup huge pages (huge pages are not charged, not just uncounted)
- Does not account for cgroup async/sync page reclaim
- Cgroup RSS and process RSS have inconsistent accounting methods
- shmem accounting is messy
Unsolved Mysteries#
Huge pages have solved many problems, but not all. The unsolved portion remains to be researched — hopefully clarified in 2026.
Pay Attention to the OS#
Pay Attention to Everything OS#
To operate open-source databases well, you need to understand the operating system.
(Source forgotten)
To operate PostgreSQL well, understanding OS principles is essential. PostgreSQL is built on top of the OS (especially Linux) — it uses whatever Linux provides. PostgreSQL is part of the Linux ecosystem. To truly understand how it works, understand the OS first.
Rule out OS-level issues before tackling PG instance-level issues.
(My own words)
I. CPU
Since PostgreSQL doesn’t use NUMA, whether on bare metal or cgroup/pod-managed CPU, you rarely need to dive into OS-level CPU internals. CPU issues can mostly be diagnosed from SQL or PG stack traces.
II. Memory
See the Memory section. Memory issues require OS-level investigation.
III. Processes
Inspecting PG process states from the OS is critical. You need to check D state, wchan, RSS, syscalls, at minimum.
IV. Host Status and Logs
Monitor host status — CPU, memory, IO, network, logs at the host level. Very important.
It’s hard to imagine that a vague network IO alert like “an I/O error occurred while sending to the backend” is related to underlying storage. Beyond /var/log/messages, PG itself shows nothing. (Of course, this error may have other causes — don’t misinterpret.)
V. Others
Uncategorized.
Physical Reads#
PostgreSQL itself does not directly expose a “true physical disk read” metric. The various reads in pg_stat_* (e.g., pg_stat_database.blks_read) are reads from the OS cache.
So how do you monitor physical reads?
Reads or buffer allocation metrics are supplementary. The best approach is monitoring the OS itself.
The OS is PostgreSQL’s ecosystem. Never look at the database in isolation. Not being able to monitor physical reads at the database level is nothing to be ashamed of — as long as you have a solution.
Monitor iostat and other disk metrics. For cloud environments, OS-level observability is already mature — don’t waste cloud-native observability.
Autovacuum#
SQL for monitoring autovacuum processes: sql autovacuum_queue_and_progress
Autovacuum Freeze on Large Databases#
With properly configured parameters, monitoring, and alerting, autovacuum freeze requires little attention in most databases.
However, in databases with extremely high transaction throughput and very large data volumes, you still can’t ignore it. Autovacuum prevent wraparound may be running constantly. At minimum, watch these two points:
- Age alerting: handle promptly and try to prevent the next alert. Don’t wait until the last moment to panic (acceleration options depend on version, e.g.,
INDEX_CLEANUP OFF,BUFFER_USAGE_LIMITadjustments) - Impact on memory (especially cache). If autovacuum runs nonstop on a very large database, it impacts cache and memory
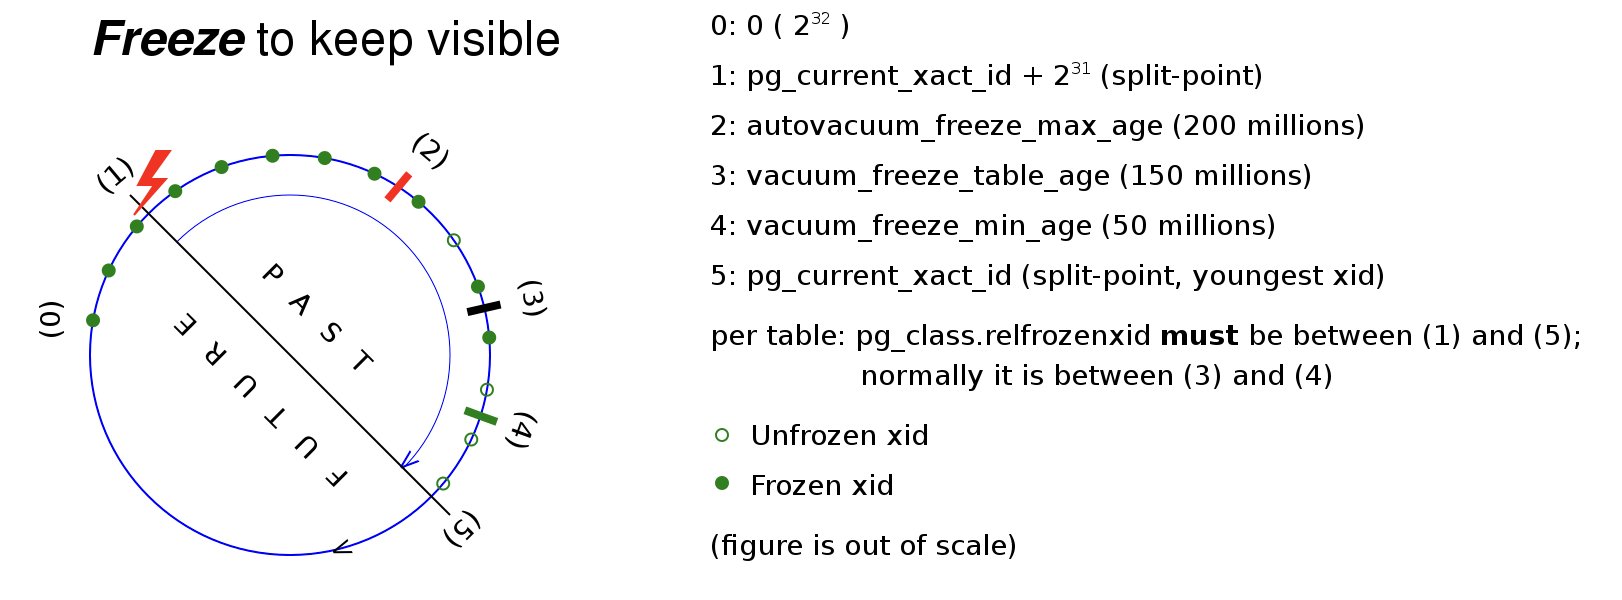
For principles and parameters, see this howtos diagram:
Large Tables That Won’t Finish Vacuuming#
“Large tables” means hundreds of GB, typically with many indexes and dead tuples that prevent vacuum from completing.
The main bottleneck: (auto)vacuum cleans dead index tuples one by one per dead row. Large table (auto)vacuum is slow here — you’ll typically see many dead tuples on the table. Worse, (auto)vacuum may run slower than the rate of dead tuple generation — vacuum never finishes, infinite bloat.
Experience with large tables that can’t finish:
- For the same table, dead tuple count is roughly proportional to execution time
- From autovacuum log’s user time and elapsed time, you can observe CPU time and execution time, and roughly estimate delay sleep time
- Disabling autovacuum cost-based delay can reduce execution time by ~3× (index-size dependent; based on a 200GB table with 280GB indexes)
- Adjusting a table’s autovacuum cost-based delay means letting autovacuum rest less when processing that table — consuming more CPU and scan IO in a shorter time
How to accelerate?
- Repack. Repack is a nuclear option — fast table rebuild for emergencies. But repack is a CLI tool; running it manually each time is cumbersome.
- Tune autovacuum cost-based delay parameters. Either 1. Increase cost limit:
alter table t1 SET (autovacuum_vacuum_cost_limit=1000);, or 2. Disable delay entirely:alter table t1 SET (autovacuum_vacuum_cost_delay=0);. Recommended only for tables that can’t keep up. - Drop unnecessary indexes. Scanning indexes and updating index entries takes the most time — dropping unnecessary indexes is effective.
- Partitioned tables. Recommended partition size ≤10GB. Converting to partitioned tables is the best solution.
- Drop updated_time column indexes to leverage HOT, reducing bloat rate.
Checkpoint and Bgwriter#
The checkpointer not only creates checkpoints (affecting recovery time) but also flushes dirty buffers. The bgwriter only flushes dirty buffers. Starting from PG 17, some metrics moved to pg_stat_checkpointer. For PG ≤16, mainly look at pg_stat_bgwriter.
I. Checkpoint intervals
- Metric
checkpoints_timed: corresponds tocheckpoint_timeoutparameter - Metric
checkpoints_req: corresponds tomax_wal_sizeparameter
Recommend using checkpoint_timeout as the primary checkpoint interval. If checkpoints_req appears, increase max_wal_size and tune flush parameters accordingly. When FPIs are present, also check these two metrics.
II. Flush metrics
- Metric
buffers_checkpoint: dirty buffers flushed by checkpointer - Metric
buffers_clean: dirty buffers flushed by bgwriter - Metric
buffers_backend: dirty buffers flushed by backends — should be as close to zero as possible; occurrence means bgwriter isn’t aggressive enough - Metric
buffers_backend_fsync: meaning unclear
The tuning goal is flush priority: bgwriter flush > checkpointer flush > backend flush
The checkpointer can flush as a side effect, but checkpointer flush speed is hard to control — it can cause IO spikes. So bgwriter flush priority should be higher than checkpointer. Backend flush is obviously worst — minimize it.
III. Bgwriter flush parameters
Bgwriter controls flush speed through a “write some, pause, write again” cycle:
- Parameter
bgwriter_delay: how long to pause - Parameter
bgwriter_lru_maxpages: max pages to write per cycle - Parameter
bgwriter_lru_multiplier: pages per cycle = (recent buffer allocation × lru_multiplier), capped at lru_maxpages - Parameter
bgwriter_flush_after: fsync after writing this many buffers - Metric
pg_buffers_alloc: represents shared memory buffer allocation (allocation means actual eviction occurred, somewhat indicative of pgpgin) - Metric
maxwritten_clean: number of timesbgwriter_lru_maxpageswas reached
Default bgwriter flush logic: each cycle: flush (new buffer count × 2, max 100 dirty buffers), delay 200ms, fsync every 64 buffers flushed.
Per-cycle flush volume depends on recent buffer allocation and bgwriter_lru_multiplier. During peak times, buffer allocation is typically high, so it usually hits bgwriter_lru_maxpages. Thus: bgwriter_lru_maxpages caps peak flush volume; bgwriter_lru_multiplier prevents excessive flushing during off-peak times.
IV. Flush parameter reference
Default max bgwriter flush = 100 × 5 × 8KB = 3.9MB/s. The defaults are definitely too low. If tuning upward, adjust based on shared_buffers size and workload.
After all that theory, here’s a practical reference:
#Read/write ratio 2:8, high load
shared_buffers=40GB
checkpoint_timeout=20min;
max_wal_size=80GB
bgwriter_delay=20ms
bgwriter_lru_maxpages=1000
bgwriter_lru_multiplier=4
Adjust further as needed.
As for effects: from practical experience, don’t expect standalone bgwriter tuning to yield great results. Overly aggressive bgwriter tuning can even backfire.
So: If your database hasn’t been clearly diagnosed with checkpoint flush spikes or other flush issues, don’t touch this. Only recommended for core large databases with high concurrency, as a supplementary tuning strategy alongside other changes (migrations, shared_buffer adjustments, etc.).
V. Flush parameter summary
Bgwriter flushing can be summarized as “three hard’s”:
“Hard to understand, hard to tune, hard to see results.”
DB4AI#
AI Task Scheduling Writes to Database#
AI applications are widely deployed at the development level. One scenario: AI task invocations write to the database. Task invocations can spike instantly, and the database writes may lack concurrency control, causing CPU or other resource spikes.
This is a new database incident pattern in the AI era. Be careful.
Vector HNSW#
HNSW Index Build Acceleration#
HNSW index builds can be extremely slow — millions of rows can take hours.
Factors affecting HNSW build speed include instance memory (and CPU) as well as index build parameters:
maintenance_work_mem=3g
max_parallel_maintenance_workers=2
m=12
ef_construction=100
Building HNSW indexes can be painful. Ways to accelerate:
- Building the index before data load is an option. Though the total initial time is slower, developers may accept “a bit slower” but cannot accept “index building for 1 hour.”
- Optimizing post-load index builds:
SET maintenance_work_mem = '8GB'SET max_parallel_maintenance_workers = 8
Post-load index builds need attention to memory — strongly related to instance memory and free memory.
Note:
maintenance_work_memcan protect OS memory. Ifmaintenance_work_memexceeds available OS memory and the table is large, the connection is terminated immediately (fast failure):ERROR: 53200: could not resize shared memory segment "/PostgreSQL.1390017142" to 6439348672 bytes: Cannot allocate memory LOCATION: dsm_impl_posix, dsm_impl.c:314Note: if memory used during build exceeds
maintenance_work_mem, an info notice appears (after some time):NOTICE: 00000: hnsw graph no longer fits into maintenance_work_mem after 886990 tuples DETAIL: Building will take significantly more time. HINT: Increase maintenance_work_mem to speed up builds. LOCATION: InsertTuple, hnswbuild.c:525
HNSW Index Query Performance#
Query recall and performance need to be balanced via the ef_search parameter.
Besides ef_search, one more factor significantly impacts query speed: whether the HNSW index is cached in memory.
Index NOT in memory:
explain (analyze,buffers) SELECT image_id, applyNo, feature_vector <-> (select vectorsit
    FROM image_features_test2
    ORDER BY distance
    LIMIT 10;
                                                                              QUERY PLAN
----------------------------------------------------------------------------------------------------------------------------------------------------------------------
 Limit  (cost=11852.80..11865.74 rows=10 width=35) (actual time=82193.073..82193.185 rows=10 loops=1)
   Buffers: shared hit=1796 read=9309
   I/O Timings: shared/local read=82108.559
   InitPlan 1 (returns $0)
     ->  Limit  (cost=0.00..0.02 rows=1 width=32) (actual time=0.008..0.009 rows=1 loops=1)
           Buffers: shared hit=1
           ->  Seq Scan on test_0  (cost=0.00..23.60 rows=1360 width=32) (actual time=0.007..0.008 rows=1 loops=1)
                 Buffers: shared hit=1
   ->  Index Scan using idx_feature_hnsw on image_features_test2  (cost=11852.78..1292546.60 rows=989705 width=35) (actual time=82193.071..82193.179 rows=10 loops=1)
         Order By: (feature_vector <-> $0)
         Buffers: shared hit=1796 read=9309
         I/O Timings: shared/local read=82108.559
 Planning:
   Buffers: shared hit=1
 Planning Time: 0.130 ms
 Execution Time: 82193.279 ms
Index IN memory:
                                                                           QUERY PLAN
----------------------------------------------------------------------------------------------------------------------------------------------------------------
 Limit  (cost=11852.80..11865.74 rows=10 width=35) (actual time=20.240..20.350 rows=10 loops=1)
   Buffers: shared hit=11105
   InitPlan 1 (returns $0)
     ->  Limit  (cost=0.00..0.02 rows=1 width=32) (actual time=0.007..0.008 rows=1 loops=1)
           Buffers: shared hit=1
           ->  Seq Scan on test_0  (cost=0.00..23.60 rows=1360 width=32) (actual time=0.007..0.007 rows=1 loops=1)
                 Buffers: shared hit=1
   ->  Index Scan using idx_feature_hnsw on image_features_test2  (cost=11852.78..1292546.60 rows=989705 width=35) (actual time=20.239..20.344 rows=10 loops=1)
         Order By: (feature_vector <-> $0)
         Buffers: shared hit=11105
 Planning:
   Buffers: shared hit=1
 Planning Time: 0.093 ms
 Execution Time: 20.392 ms
Same index, same execution plan — the performance difference between index-in-memory and index-not-in-memory is 82193.279 / 20.392 = 4000×!
This gap cannot be ignored. When monitoring HNSW index performance, always check whether the index is in memory. Reference SQL:
--Check if HNSW index is cached in shared buffers via pg_buffercache
SELECT     c.relname,     pg_size_pretty(count(*) * 8192) as buffered,     round(100.0 * count(*) / (SELECT setting FROM pg_settings WHERE name='shared_buffers')::integer, 1) AS buffer_percent,     round(100.0 * count(*) * 8192 / pg_table_size(c.oid), 1) AS percent_of_relation FROM pg_class c INNER JOIN pg_buffercache b ON b.relfilenode = c.relfilenode INNER JOIN pg_database d ON (b.reldatabase = d.oid AND d.datname = current_database()) GROUP BY c.oid, c.relname ORDER BY 3 DESC LIMIT 10;
relname | buffered | buffer_percent | percent_of_relation
---------------------------------+------------+----------------+---------------------
idx_feature_hnsw_1 | 2117 MB | 91.9 | 44.5
idx_feature_hnsw | 78 MB | 3.4 | 2.0
pg_inherits_parent_index | 8192 bytes | 0.0 | 100.0Application Releases#
DDL Tips#
Online DDL tools like pg-osc and pg_migrate don’t support partitioned tables, and they have other issues — real-world use is difficult. So DDL tips are still useful: lowering lock levels, proactively identifying blocking, etc., to reduce DDL blocking and rewrite risks.
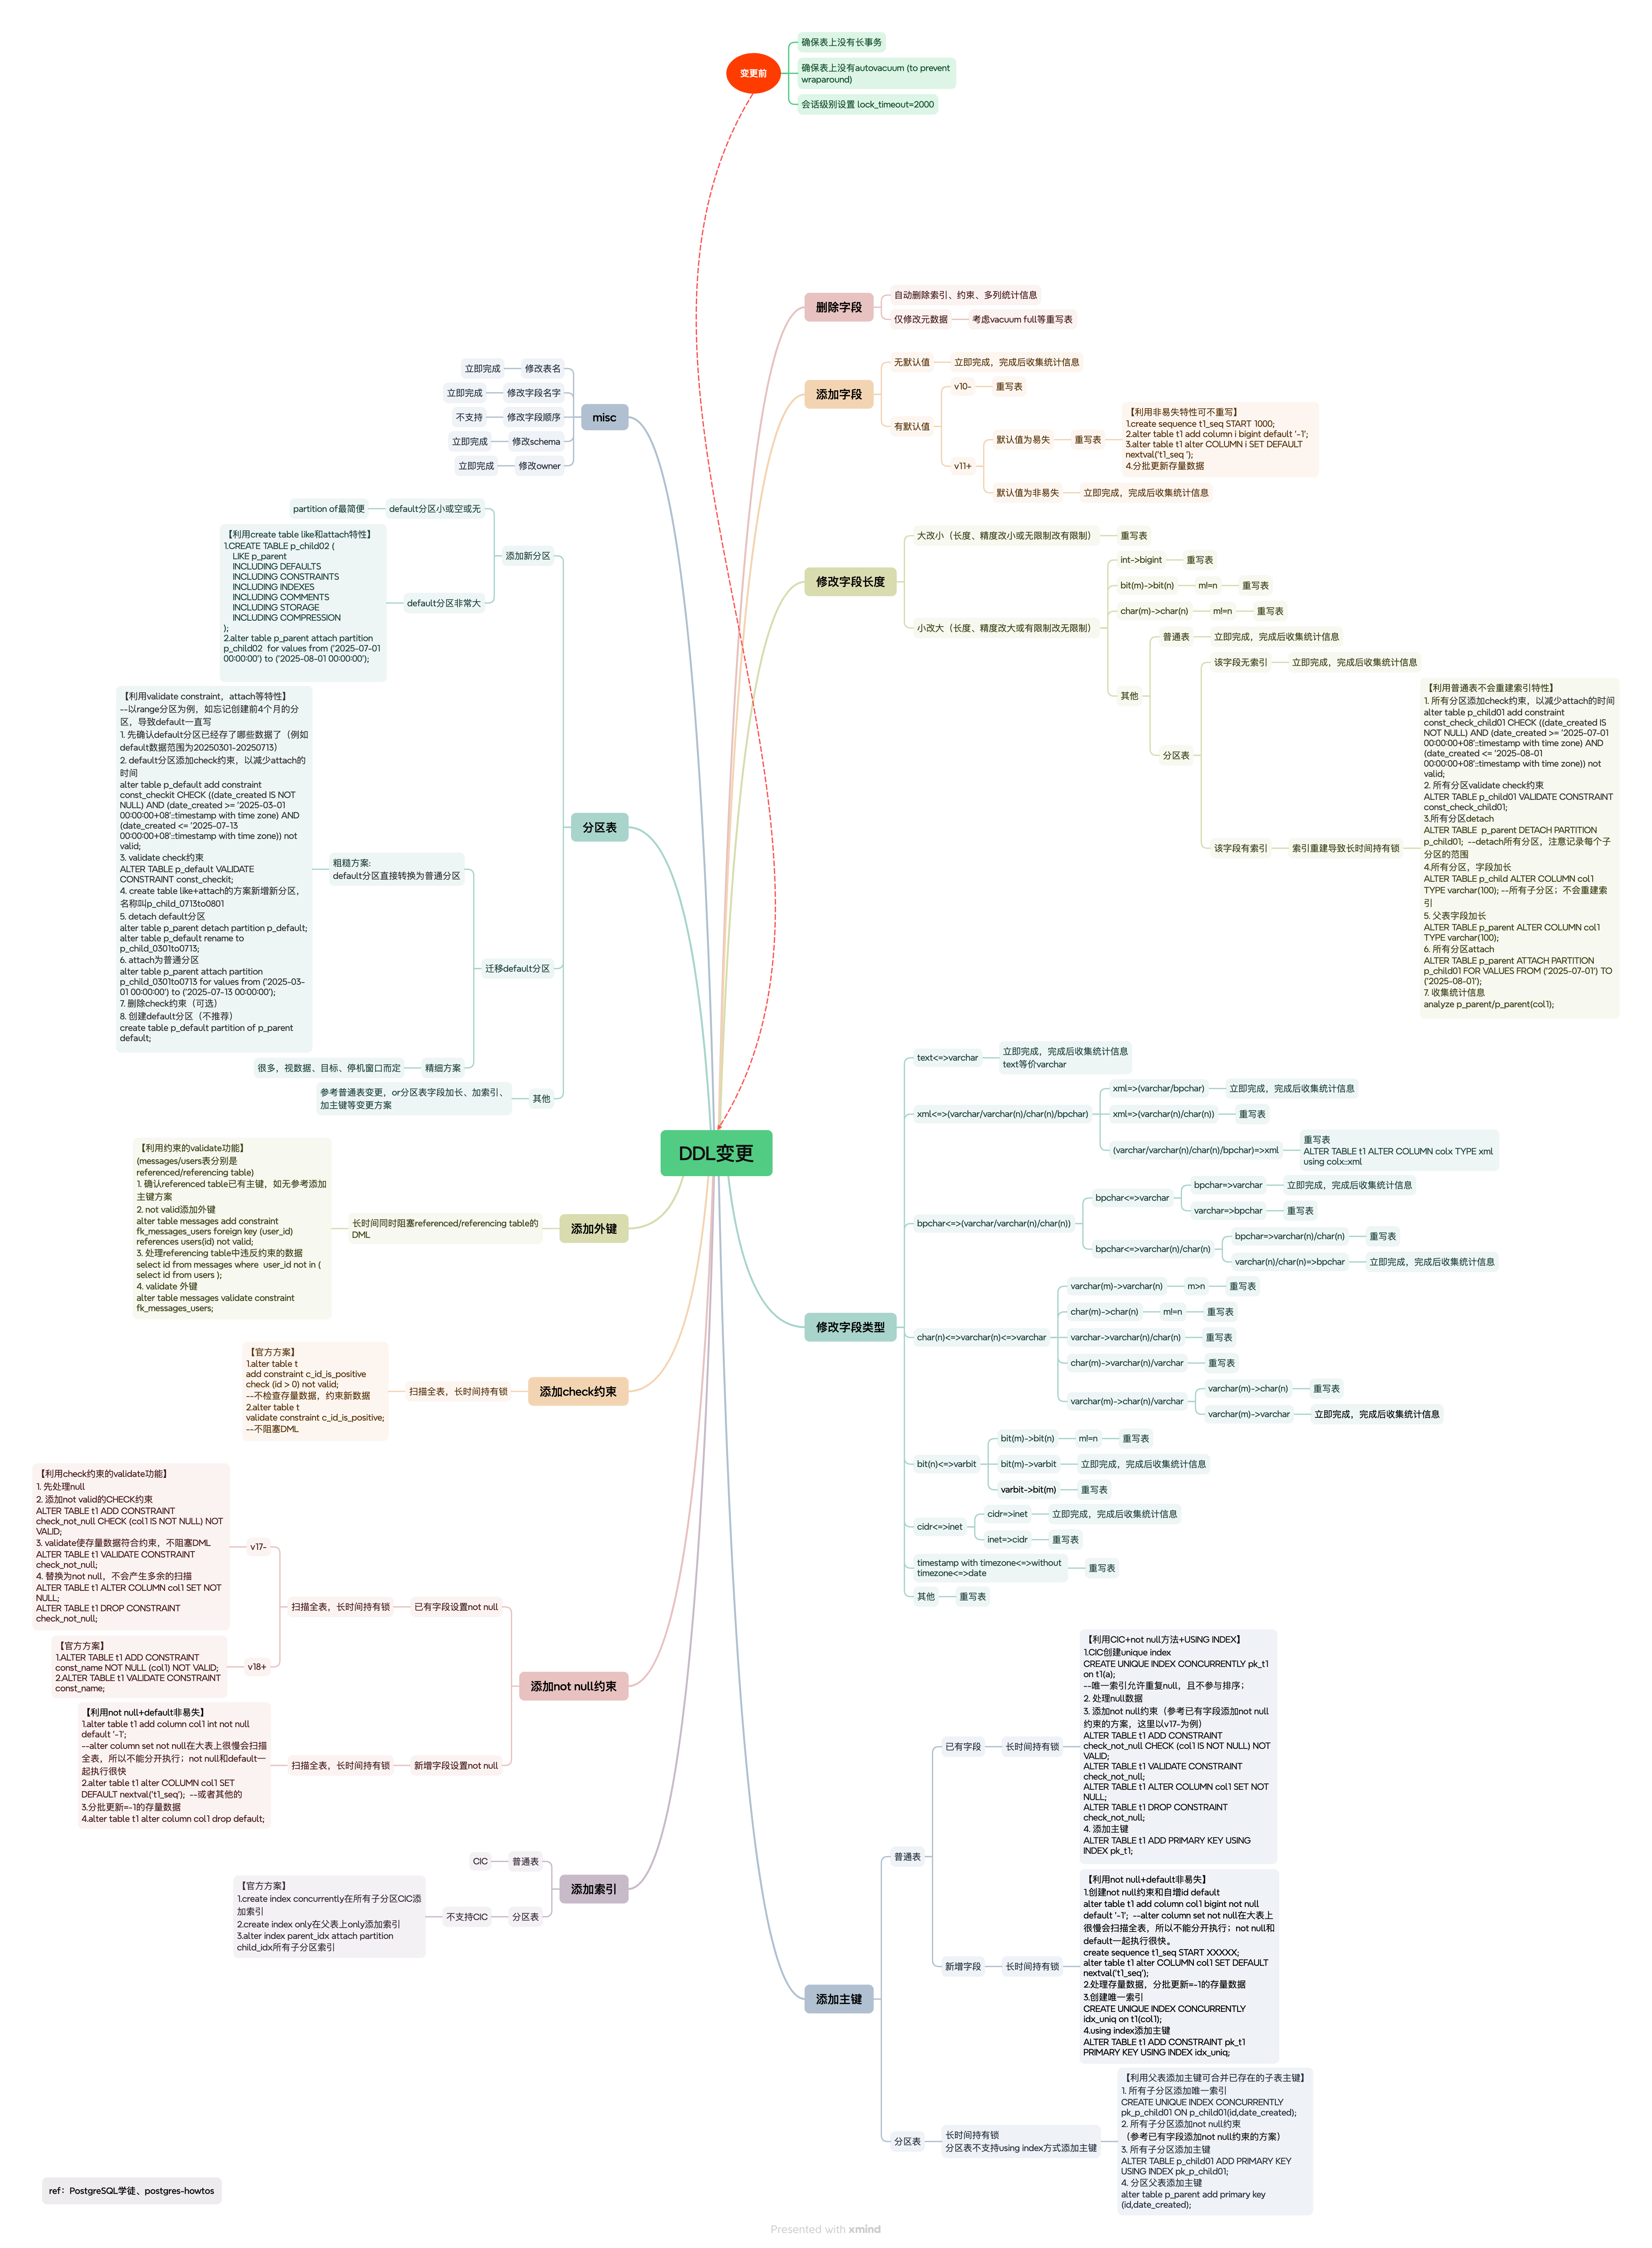
Key points for understanding this diagram:
Before changes:
Ensure no long transactions on the table — long transactions hold locks on tables persistently. Long transactions are a well-known hazard in PG; handle them first.
Ensure no autovacuum (to prevent wraparound) on the table — autovacuum generally doesn’t block SQL, except when running to prevent wraparound:
Autovacuum workers generally don’t block other commands. If a process attempts to acquire a lock that conflicts with the
SHARE UPDATE EXCLUSIVElock held by autovacuum, lock acquisition will interrupt the autovacuum. However, if the autovacuum is running to prevent transaction ID wraparound (i.e., the autovacuum query name in thepg_stat_activityview ends with(to prevent wraparound)), the autovacuum is not automatically interrupted.lock_timeout=2000— if a lock cannot be acquired within 2 seconds, bail out to avoid mass blocking.
Special cases for “small-to-large” type changes:
- Small-to-large type changes generally don’t rewrite the table, but there are exceptions. Pay special attention to
int → bigint(common for PK columns) andchar(n) → char(m). - Partitioned table indexes. Small-to-large type changes on partitioned tables don’t rewrite the table, but they do rebuild indexes — and rebuilding indexes on partitioned tables is typically very slow, potentially causing prolonged level-8 lock blocking. This behavior is unique to partitioned tables.
Changing column types:
- Almost always rewrites the table, except for equivalent types or small-to-large cases.
DDL lock-level reduction tips:
- Use CIC (CREATE INDEX CONCURRENTLY) for indexes. If partitions don’t support it, do CIC on child tables (remember to attach the index).
- CIC has multiple phases. Phases 2 and 3 acquire a SHARE lock, blocking DML. (Official docs only mention SHARE UPDATE EXCLUSIVE — CIC isn’t a simple explicit lock.)
- Add primary keys with
USING INDEX. For partitions, leverage “add PK on child table + add PK on parent can merge existing child PKs.” - Use
VALIDATE CONSTRAINTfor constraints. - PG <17 doesn’t support
NOT NULL VALIDATE. UseCHECK(col1 IS NOT NULL)instead. This CHECK-to-NOT-NULL conversion won’t produce extra scans. - Adding a column with a volatile DEFAULT rewrites the table. Use the non-volatile-no-rewrite property: add the column first (no rewrite), then UPDATE legacy data as needed.
- When attaching partitions, use CHECK constraints to reduce downtime, and use
VALIDATE CONSTRAINTfor the CHECK. CREATE TABLE LIKE+ATTACHhas much lower lock levels thanPARTITION OF(though I still preferPARTITION OF).
After changes:
- Remember to collect statistics (needed in many scenarios).
Parallel Index Creation#
In production, you may need to create indexes on very large tables that take a long time. Parallel index creation can shorten build time.
Parallel index creation on regular tables:
Parallel parameter: max_parallel_maintenance_workers
Prerequisites:
- Enough workers: check
max_parallel_workers,max_worker_processes - Increase
maintenance_work_memto GB scale
Notes:
- Effective for B-tree and BRIN
maintenance_work_memlimits the entire utility command. Unlike parallel query, where resource limits are per worker process.
From test results, parallel index creation shows diminishing returns beyond 8 workers (this conclusion may not hold in all environments).
Parallel index creation on partitioned tables:
Recommend manual parallel creation across child partitions — run index creation on multiple partitions simultaneously rather than using native parallelism. This reduces multi-process coordination overhead.
Cached Plan Must Not Change Resource#
After adding a new column the previous night, application connections started throwing errors the next morning: “cached plan must not change result type in PostgreSQL”
Reproduction:
create table a(b varchar(10));
PREPARE p1 (varchar) AS SELECT * FROM a WHERE b=$1;
ALTER TABLE a ALTER COLUMN b TYPE varchar(20);
EXECUTE p1 ('abcd');

ERROR:  0A000: cached plan must not change result type
LOCATION:  RevalidateCachedQuery, plancache.c:718
Test environment solutions:
DEALLOCATE ALL — actively discard prepared statements
Or,
DISCARD ALL — actively discard all session state
DEALLOCATE ALL;  --DISCARD ALL
PREPARE p1 (varchar) AS SELECT * FROM a  WHERE b=$1;
EXECUTE p1 ('abcd');
Production environment solutions:
Since the error occurs at the application layer, JDBC can handle DEALLOCATE ALL / DISCARD ALL, but the application may not have implemented this. Immediate production solutions:
Solutions (choose one):
- Since connection pools like HikariCP have connection cycling and timeout mechanisms, killing idle sessions will gradually reduce errors.
- Similarly, due to connection pool cycling, you can do nothing — as the pool gradually establishes new connections, the errors fade.
- If business pressure is high enough, consider killing all application connections.
- Rolling restart of the application.
Not recommended:
- “Restart the application after every DDL.” It works but don’t recommend this as a standard practice.
autosave=conservative. It works but enables subtransactions. A savepoint is set for each query; rollback happens only for rare cases like ‘cached statement cannot change return type’ or ‘statement XXX is not valid,’ where the JDBC driver rolls back and retries.
JDBC configuration suggestions:
- Configure automatic retry after transaction rollback: https://developer.aliyun.com/article/741750
- Other JDBC config references: https://jdbc.postgresql.org/documentation/server-prepare/#corner-cases. Note: some suggestions are not suitable for production.
Physical Replication#
Query Conflicts#
Query conflicts are a notoriously frustrating feature that directly impacts the usability of PG standby queries. Query conflicts increase standby lag, yet long-running queries on the standby are logically reasonable. This forces PG administrators to balance between lag management and long-query management — a problem that doesn’t exist in other relational databases.
Hidden characteristics of query conflicts:
- Even static tables can trigger query conflicts (see: From Static Table Query Conflicts to Their Principles). The conflict is a snapshot conflict, largely unrelated to table-level locks — snapshot conflicts are cross-table.
- Long queries affect short queries. Once a long query pushes standby lag to
max_standby_streaming_delay, even short queries get canceled. - Continuous short queries also cause query conflicts. For example, one short query hasn’t finished when the next starts — the two queries may be logically similar, and the startup process hasn’t had time to apply WAL. Both short queries hold the XID that needs to be applied. Check whether
pg_stat_activity.backend_xminis less than the XID the startup process is applying.
Recommended standby query practices:
- Using RTO SLO to tune
max_standby_streaming_delayis a good approach. When arguments lead nowhere, SLO-based IT management saves the day. - Separate short/fast business queries from long queries (data extraction, reporting) onto different standbys to reduce mutual interference.
- Standby queries still need SQL optimization.
- Standby WAL apply lag must be monitored.
Logical Replication#
Logical replication has countless pitfalls. 2024 had many nasty cases; 2025 had some too, but less severe, mostly on older PG versions. Overall, logical replication on newer PG versions is trending toward stability.
Slow DDL/DCL Parsing on Older PG Versions#
Case Study: GRANT and Walsender Stuck
On PG 13 and earlier, certain DDL/DCL statements parse slowly and may affect walsender lag. These include:
- Batch GRANT (including grant all tables) + pathman extension installed (whether used or not)
- Batch DDL/TRUNCATE/DCL/DROP PUBLICATION
Older PG + Multiple Replication Links + Flink#
Flink requires one link per table. Since PostgreSQL walsenders re-decode independently, dozens of Flink links on one PG database are common — and hard to refactor.
On PG 11 and earlier, the walsender main loop calls PostmasterIsAlive(), causing poor loop performance. Starting from PG 12, WalSndLoop no longer polls PostmasterIsAlive() in the main loop; instead, status checks are placed inside WalSndWait, using event-based passive notification. This greatly reduces CPU contention.
If you have multiple Flink links on an older PG version, upgrading can alleviate certain walsender resource contention issues, including:
- May resolve the problem where walsender startup resource contention prevents the database from coming up for a long time
- May resolve upstream heavy data changes (including DDL rewrites) causing runtime walsender log decoding CPU saturation
Older PG Cannot Auto-Sync New Partitions#
On older PG versions with declarative partitioning, note that you can only publish child tables individually. PG ≥13 supports publishing by parent table. Below that, you must configure sync per partition child table name:
Allow partitioned tables to be logically replicated via publications (Amit Langote) § §
Previously, partitions had to be replicated individually. Now a partitioned table can be published explicitly, causing all its partitions to be published automatically. Addition/removal of a partition causes it to be likewise added to or removed from the publication. The
CREATE PUBLICATIONoptionpublish_via_partition_rootcontrols whether changes to partitions are published as their own changes or their parent’s.
In other words, if this partitioned table is an upstream for sync, every time a new partition is added, you must adapt the sync tool to publish it — otherwise, new partition data won’t sync.
Migration and Upgrades#
Xinchuang Migration and glibc Upgrades#
Whether it’s Xinchuang (domestic tech migration) or Linux OS version upgrades, glibc upgrades may be involved — and glibc upgrades can be extremely painful. PG sorting was entirely OS-dependent before PG 17.
PostgreSQL cannot detect compatibility issues from glibc upgrades. Every minor version of GNU C library makes locale changes. The most problematic version in practice is glibc 2.28, because 2.28 upgraded to a major Unicode 9.0.0 release (has been updated to a new upstream version from ISO which is in sync with Unicode 9.0.0).
Collations come in many types, and many environments use linguistic sorting (e.g., en_US.utf8), which is the most version-sensitive. Collation changes most commonly cause database crashes during index scans, but also uncommon issues like duplicate primary keys, data landing in wrong partitions, inconsistent merge join results, etc.
Fortunately, PG 17 provides a very safe locale provider: builtin, no longer dependent on OS-provided glibc, ICU, etc. Example:
initdb --locale-provider=builtin --bultin-locale=C.UTF-8 dbname1However,
builtin is great but arrived too late. Converting existing production instances to builtin collation is no small task. Moreover, Xinchuang migrations or OS upgrades may not mandate database upgrades.
During Xinchuang migration, the target host’s glibc version is typically higher than the old Intel server’s — likely crossing version 2.28. Combined with tight deadlines, KPI pressure, staffing shortages, and large databases, physical migration is unavoidable. So physical Xinchuang migration must account for glibc version and collation-induced anomalies.
What can you do after physical migration?
I. Official required steps
- Check indexes, rebuild those clearly problematic
REFRESH DATABASE COLLATION VERSION- Check dependent objects
REFRESH COLLATION VERSION
II. Unofficial “dark arts” approaches
I don’t have a complete solution, just ideas:
Handle partitioned table data landing in wrong partitions
- Partition key is int/bigint/float: unrelated to collation, don’t worry
- Partition key is timestamp: don’t worry; if varchar or other character types: evaluate
- Partition key is character type: refer to “a” vs “-” sort order (pgconf Collation Challenges Sorting It Out). But note:
- If querying data, don’t query from the parent table — may crash or return nothing
- No simple detection method
Handle primary key / unique key conflicts
Handle FDW sort range anomalies
Unknown issues
Reference: collation
Smooth Major Version Upgrades#
Common major version upgrade approaches:
pg_upgradein-place upgrade. Not recommended — may blow up in place.pg_dump: suitable for small databases, longer maintenance windows.- Logical sync + switchover (pub/sub, pg_logical, DTS, etc.): suitable for small databases, shorter windows.
- Physical forward sync + logical reverse sync: suitable for large databases, not-too-short windows.
- Physical replication full sync + logical incremental sync + switchover: suitable for large databases, extremely short windows.
Syncing full data via logical replication can be extremely slow. In-place upgrade of a new standby carries uncertainty and upgrade time, plus the need for reverse logical sync. “Smooth major version upgrade” is essentially “physical replication full sync + logical incremental sync + switchover.”
Key technique: the primary creates a slot and returns an LSN. The new standby uses recovery_target_lsn to recover to that LSN, then logical sync begins.
Approximate workflow:
- Pre-checks. Multi-database (consider applying one slot LSN for all), extensions, pathman, triggers, foreign keys, unlogged tables, crontab, etc.
- Physical sync. Old and new version software, compare and backup conf files,
pg_basebackupto build new standby on old version. - Logical sync prep 1. Primary keys and replica identity, create publication; prohibit application DDL/DCL.
- Restore new standby to target LSN. Stop new standby; create slot on old primary and record LSN; start new standby with target LSN.
- New standby major version upgrade. Upgrade, handle issues, switch environment variables.
- Logical sync prep 2. Disable triggers, foreign keys, jobs, extensions, etc.
- Logical sync. Create subscription with specified slot,
copy_data=false. - Post logical sync. Check for index corruption, check logs for errors and fix, rebuild remote standbys.
- Switchover. Stop application; advance sequences, enable foreign keys, triggers, jobs, etc.
- Switchover. Build reverse link (old primary subscribes).
- Switchover. Application cutover.
The smooth major upgrade approach is smooth for the business but complex for the DBA. It combines all the drawbacks of logical and physical migration — quite painful to execute. The steps above are already simplified. This approach consumes DBA manpower; consider it only for the most critical databases.
Partitioned Table Management#
PostgreSQL partitioned tables are very flexible, lack built-in interval partitioning, and have varied behavior across versions — making partition management problems an annual occurrence. I believe many PG DBAs still worry about new partition issues.
My observations on partition management and usage issues:
- Not using declarative partitioning. Older versions still use pathman partitioning or inheritance-based partitioning, or continue using them even after upgrading. Declarative partitioning was introduced in PG 10. Due to early version limitations, recommend only using declarative partitioning from at least PG 12 onward to reduce environmental complexity.
- Developers building child table indexes/primary keys directly. Creating indexes/PKs directly on child tables via SQL rather than through parent table inheritance means the next developer writing SQL may forget. This leads not only to parent-child inconsistency but also child-child inconsistency, eventually making the partition structure unrecognizable.
- No new partition management strategy. Forgetting to create new partitions or using a DEFAULT partition. Typically, developers create partitions for a few years ahead; next time, the developers may have moved on, and no one manages new partition creation. This is a ticking time bomb, or data lands in the DEFAULT partition, defeating the purpose of partitioning.
- Lack of DBA management. Yes, DBA! PG partitioned table knowledge is extensive (see PostgreSQL Partitioned Tables). How to build management strategies and implement them in your environment requires proactive DBA involvement. This may be the most important factor.
My partition management goals (from Case Study: 2026-01-01 Partition Data Update Failure):
- Use the parent table structure as the canonical structure — the parent table faces developers; it should have primary keys, indexes, and replica identity (unless the PG version doesn’t support it).
- Keep parent and child tables consistent. Use
PARTITION OFwhen creating new partitions (yes, I don’t recommend ATTACH). - Keep child tables consistent with each other.
- Create new partitions in advance. Partition data volume should not be too large.
- DEFAULT partitions are not recommended. If created, must monitor writes to them.
- Queries on frequently accessed tables must include the partition key for partition pruning. Otherwise, convert to a regular table.
Observability#
The official documentation clearly explains database, table, index, SQL, flush, and other metrics.
A few metrics deserve special attention — not only are they unclearly explained, but they’re frequently used and have a learning curve.
buffers_alloc, blks_read#
pg_stat_bgwriter.buffers_alloc: Number of buffers allocated — shared memory eviction volume.pg_stat_database.blks_read: OS cache reads.
(buffers_alloc may appear in different views across PG versions, but the meaning is the same.)
pg_stat_bgwriter.buffers_alloc is the shared memory buffer allocation count (called buffer allocation in the source). It represents shared memory eviction volume — newly started databases typically have higher values. When observing shared memory busyness, buffer allocation may be better than hit ratio — high hit ratios can be inflated by frequent small-table access, while allocation represents actual eviction.
buffers_alloc counts buffers allocated after reading from cache and loading into a new shared buffer — somewhat representative of OS cache reads too? But in practice, buffers_alloc and blks_read have similar meanings yet can differ significantly in value. Why? Unclear, pending research.
Source: numBufferAllocs
tup_fetched, tup_returned#
These are metrics in pg_stat_database:
tup_fetched: Number of rows ultimately returned from index scans, after removing filtered rows, dead tuples, and invisible rows. Result-oriented.tup_returned: Number of rows fetched from the table during index scans, regardless of filter conditions, dead tuples, or visibility. Process-oriented.
Thus, tup_returned is typically much higher than tup_fetched. An abnormally high tup_returned suggests optimization opportunity — after all, many rows were accessed but few returned to the client.
idx_tup_fetch, idx_tup_read#
These are metrics in pg_stat_all_indexes:
idx_tup_read: Number of index entries accessed (counted from the index side), includes bitmap scans.idx_tup_fetch: Number of rows ultimately returned from index scans (counted from the table side), excludes bitmap scans.
Madness.
One thing to remember: xx_tup_fetch refers to the final rows returned after index access + table fetch — result-oriented.
References#
Best practices for using pgvector
Case Study: 2026-01-01 Partition Data Update Failure
Case Study: From Inaccurate DISTINCT to DISTINCT Calculation Principles
Case Study: Adding an Index Causes Performance Degradation and Generic Plans
From Static Table Query Conflicts to Their Principles
Control File Parameters and Primary-Standby Parameter Mismatch
https://liuzhilong.blog.csdn.net/article/details/130783036
https://www.postgresql.org/docs/17/sql-prepare.html
https://www.postgresql.org/docs/17/sql-deallocate.html
https://www.postgresql.org/docs/release/13.0/
https://jdbc.postgresql.org/documentation/use/
https://jdbc.postgresql.org/documentation/server-prepare/#server-prepared-statements
Thanks to Master Gao for the 2025 battles.