Paper: DBAIOps: A Reasoning LLM-Enhanced Database Operation and Maintenance System using Knowledge Graphs
Repo: https://github.com/weAIDB/DBAIOps/
What is DBAIOps#
- Why DBAIOps:
- Manual operations are extremely time-consuming.
- Manual operations are difficult to scale.
- Manual operations are often trapped in recurring failures.
- Documentation + RAG models are inaccurate (limited DBA experience integration).
In short, both manual operations and existing solutions are mediocre, hence DBAIOps — an operations system combining LLM reasoning and knowledge graphs to achieve DBA-like diagnostic capabilities.
- Comparison of database failure analysis approaches:
- Rule-based approach: Traditional, rigid.
- Machine learning approach: Essentially rule-based with similar limitations; depends on training data leading to lower generation capability; generally suitable for diagnosing common specific problems.
- LLM-based approach: Uses general documentation and LLMs (e.g., decision-tree-based), prone to giving generic results.
- LLM+RAG approach: Searches based on chunked top-k approximate knowledge; results are inaccurate.
- After comparing the above approaches, the advantages of DBAIOps combining graph knowledge, DBA experience, and LLMs are clear:
- Incorporates DBA experience.
- Preserves original relationships.
- Supports new root cause identification and solutions.
- Extensible.
Overview#
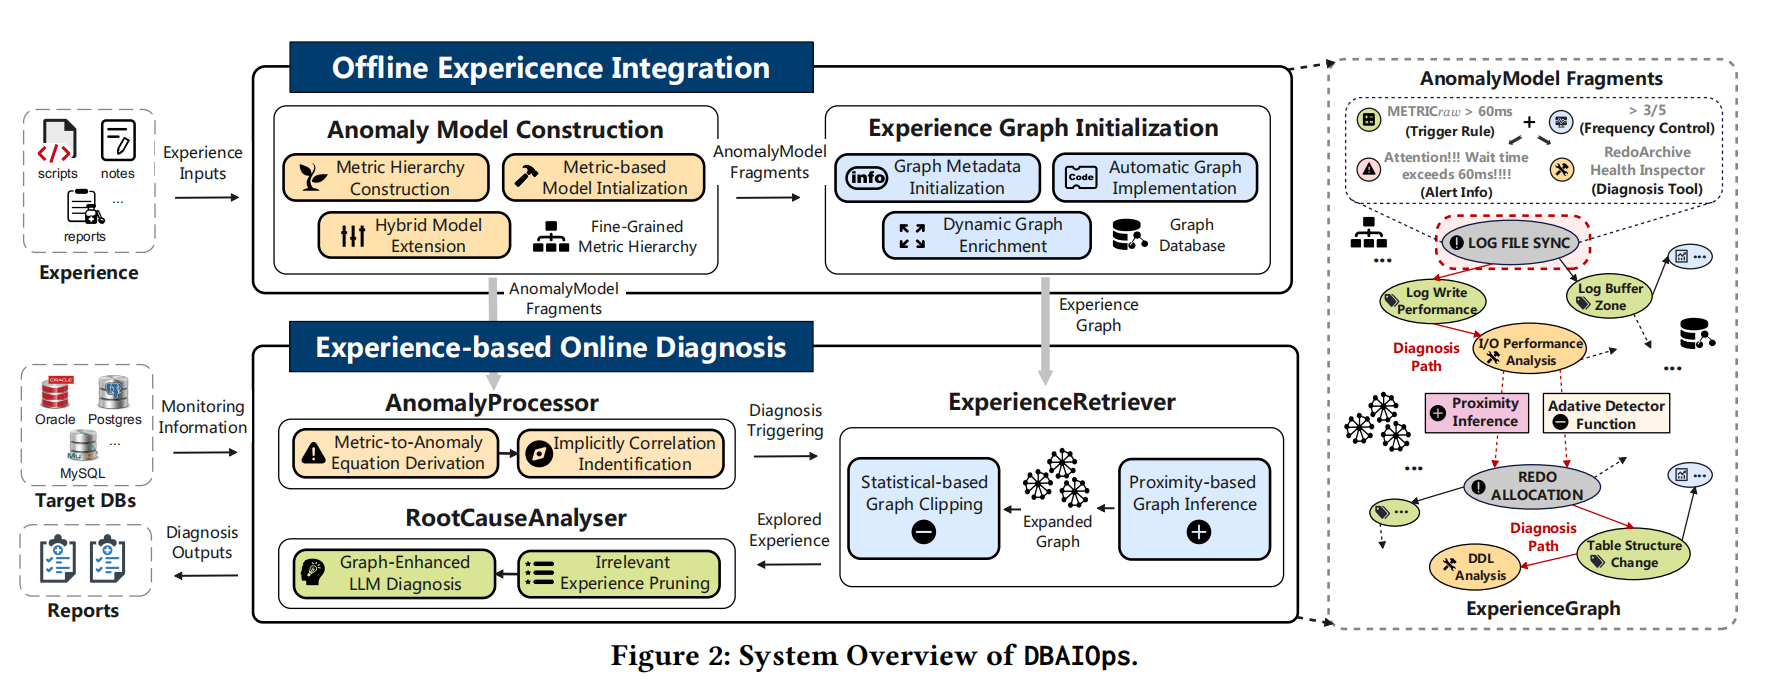
Left side is architecture, right side is an example.
Offline: DBA experience is embedded into Neo4j, with the resulting graph model called ExperienceGraph, where edges represent anomaly phenomena or metric relationships. The embedded anomaly model is called AnomalyModel.
Online: Anomaly analysis, retrieval, and report generation. The AnomalyProcessor extracts standard failure information and AnomalyModel information, then retrieves the graph via ExperienceRetriever; finally, RootCauseAnalyzer calls the LLM to generate analysis reports.
From the right-side example, we can see graph relevance finding LOG FILE SYNC associated with LOG WRITE performance and IO performance; through REDO ALLOCATION, we can find table structure changes and DDL.
The Operations Experience Graph Model#
Unlike rule-based or document-chunk-based RAG, ExperienceGraph is a graph model encoding heterogeneous operations experience information. The graph contains three elements: (vertices, directed edges, relationships on edges).
Based on the characteristics of operations experience, DBAIOps classifies vertices:
- trigger vertex: Used to detect database anomalies; the entry point for anomaly analysis. For example, LOG FILE SYNC is an entry vertex.
- metric vertex: Database runtime metrics. For offline knowledge, this refers to metrics from operations case studies (if present).
- experience vertex: Encodes domain-specific operations experience, covering anomaly meanings and handling methods. For example, LOG FILE SYNC exceeding 60ms indicates overly frequent commits or parameter adjustments needed.
- tool vertex: Executable scripts for collecting and analyzing anomaly metrics.
- tag vertex: Semantic categories of graph vertices. For example, “Concurrent Transactions” involves multiple vertex types; tag vertices strengthen cross-case associations.
- auxiliary vertex: Explains the meaning of metrics.
Edge classification:
- containment edge: Trigger Vertex - Experience Vertex
- relevance edge: Trigger Vertex - Metric Vertex
- diagnosis edge: Experience Vertex - Metric Vertex
- synonym edge: Only appears between Tag Vertices, indicating semantic synonymy, e.g., physical_read and disk_read; shared_pool and shared_buffer.
Analyzing the operations experience graph model through an example:
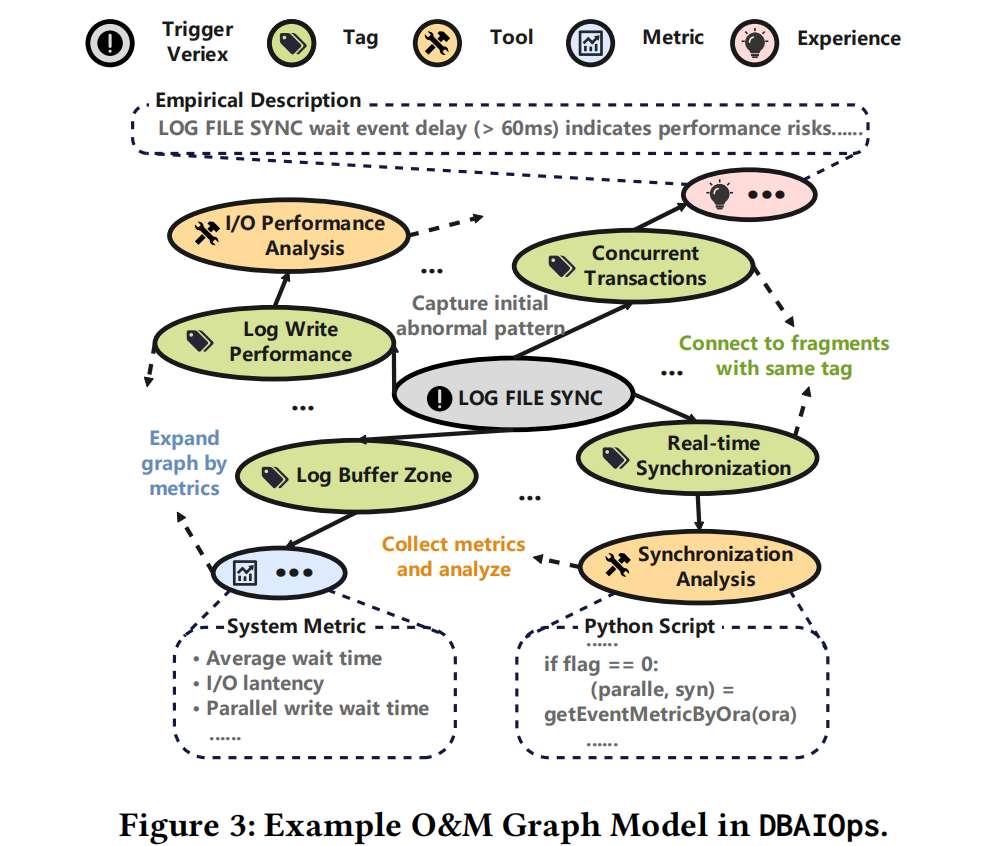
LOG FILE SYNC has multiple TAGs, and TAGs are associated with Experience, metrics, and tools. The strong relevance is evident — it represents a human DBA’s understanding and operations experience of LOG FILE SYNC.
Graph Construction#
Manual graph construction is unreliable, and existing ML-generated graphs may generate irrelevant relationships, so a semi-automatic graph generation approach is proposed.
- Graph initialization: This part is manually generated, defining trigger vertices according to rules. Once trigger vertices are generated, their associated metric vertices, experience vertices, etc., are automatically generated. This is somewhat like a human DBA guiding the creation of a knowledge sketch — the overall framework cannot be changed; nothing bizarre should be generated.
- Graph storage: Stored in Neo4J. Additionally, different database types are marked with tags, making much knowledge reusable and avoiding duplicate graph construction.
- Graph augmentation: Generating more edges.
- Graph updates: DBAIOps supports incremental updates. Updates here include both adding new vertices and removing old vertices.
Anomaly Model#
Metrics#
Metrics come from many sources, including runtime information (CPU %, throughput, etc., routine monitoring), logs, traces, etc. Combined with relevance differences, strongly correlated metrics need to be extracted. So metrics are divided into 2 categories:
- Immediately collected metrics: Runtime information, logs, traces.
- Subsequently collected metrics: Periodic, delta, etc., metrics generated when needed, such as AWR/ASH data.
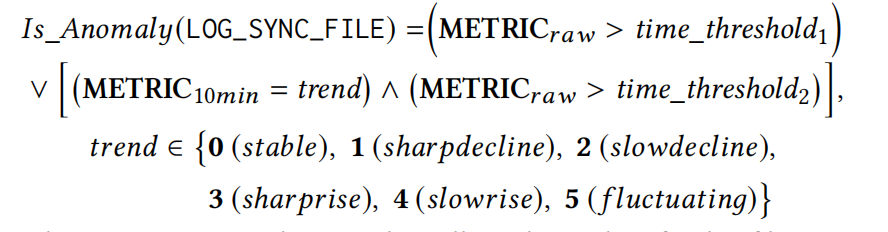
Regarding metric-anomaly correlation, unlike baseline-based approaches, DBAIOps uses specific metric combinations for each anomaly type.
Finally, a formula determines whether an anomaly has actually occurred:
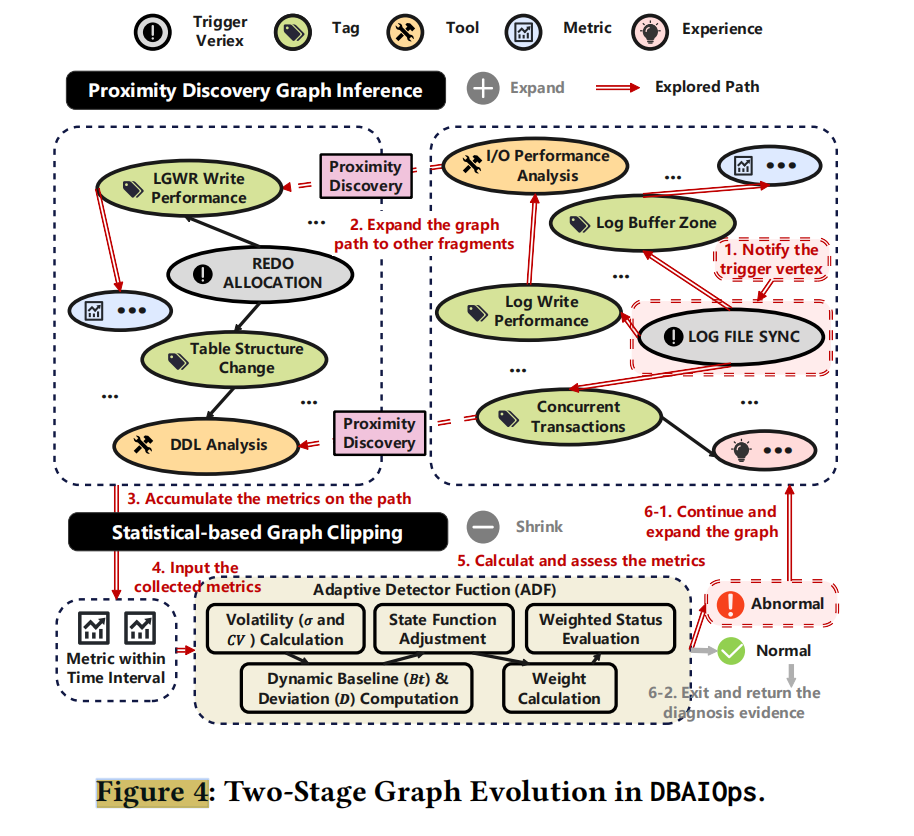
Two-Stage Graph Evolution#
Database anomalies rarely occur in isolation — one performance issue may simultaneously trigger or exacerbate others. However, connections between different anomaly models (e.g., LOG_FILE_SYNC and REDO_ALLOCATION) in pre-built knowledge graphs tend to be loose, with shared experience fragments sparse and fragmented. This makes it difficult for traditional methods to discover cross-model composite root causes, such as combined I/O bottleneck and memory pressure issues.
To address this challenge, DBAIOps proposes an automatic “graph evolution” mechanism that dynamically discovers and connects relevant experience fragments between different anomaly models, evolving the knowledge graph from an initially sparse structure into a densely interconnected network, thus supporting more comprehensive root cause analysis.
Stage 1 - Graph Inference and Proximity Discovery: Uses graph query language (Cypher) to collect and aggregate relevant metrics, traversing related nodes and edges based on configurable thresholds to build association networks. For example, starting from LOG_FILE_SYNC latency, traverse up to 3 hops of associated nodes. Establish connections between LOG_FILE_SYNC and REDO_ALLOCATION models because they are both related to I/O-related concurrency issues. Through multiple iterations, the knowledge graph gradually evolves into a denser structure, enabling diagnosis to consider more potential factors and composite causes.
Stage 2 - Adaptive Abnormal Metric Detection: Identifies truly anomalous metrics along graph expansion paths. Using an Adaptive Detection Function (ADF), it calculates composite anomaly scores considering dimensions such as metric volatility and dynamic baseline deviation. Based on anomaly scoring results, it decides whether further knowledge graph structure expansion is needed, filtering a precise subset of anomaly metrics for subsequent LLM root cause reasoning.
Generating Analysis Reports#
Once the graph is ready, prompts need to be fed to the LLM to generate desired reports. A well-structured prompt can also improve report accuracy.
Anomalies have 5 components, which serve as the prompt for the LLM:
- Anomaly: Anomaly description (“CPU usage spiked to 95% at 16:00 on 2023-10-05”)
- Condition: Anomaly trigger condition (“exceeds 90% for >5 min”)
- Metrics
- Experience: Provides normal load values or recent maintenance tasks.
- Output: Describes the report’s composition — anomaly verification (requiring further analysis), root cause analysis, recovery plan, summary, SQL text.
Some personal thoughts:
Recent maintenance tasks are very useful — maintenance tasks generally have strong correlation, and failure analysis can’t just be simple technical analysis. However, who updates these maintenance tasks and which ones to update or not update is a problem.
The first few items in output are easy to understand, but the last one — SQL text — is a stroke of genius. In production environments, aside from hardware failures, database runtime status is strongly correlated with SQL. I personally believe you can unthinkingly capture SQL and discuss causality later. From an operations perspective, failures always require joint investigation with developers, so SQL text is basically mandatory to capture.
Evaluation#
Comparison of analysis report quality across different tools and approaches:
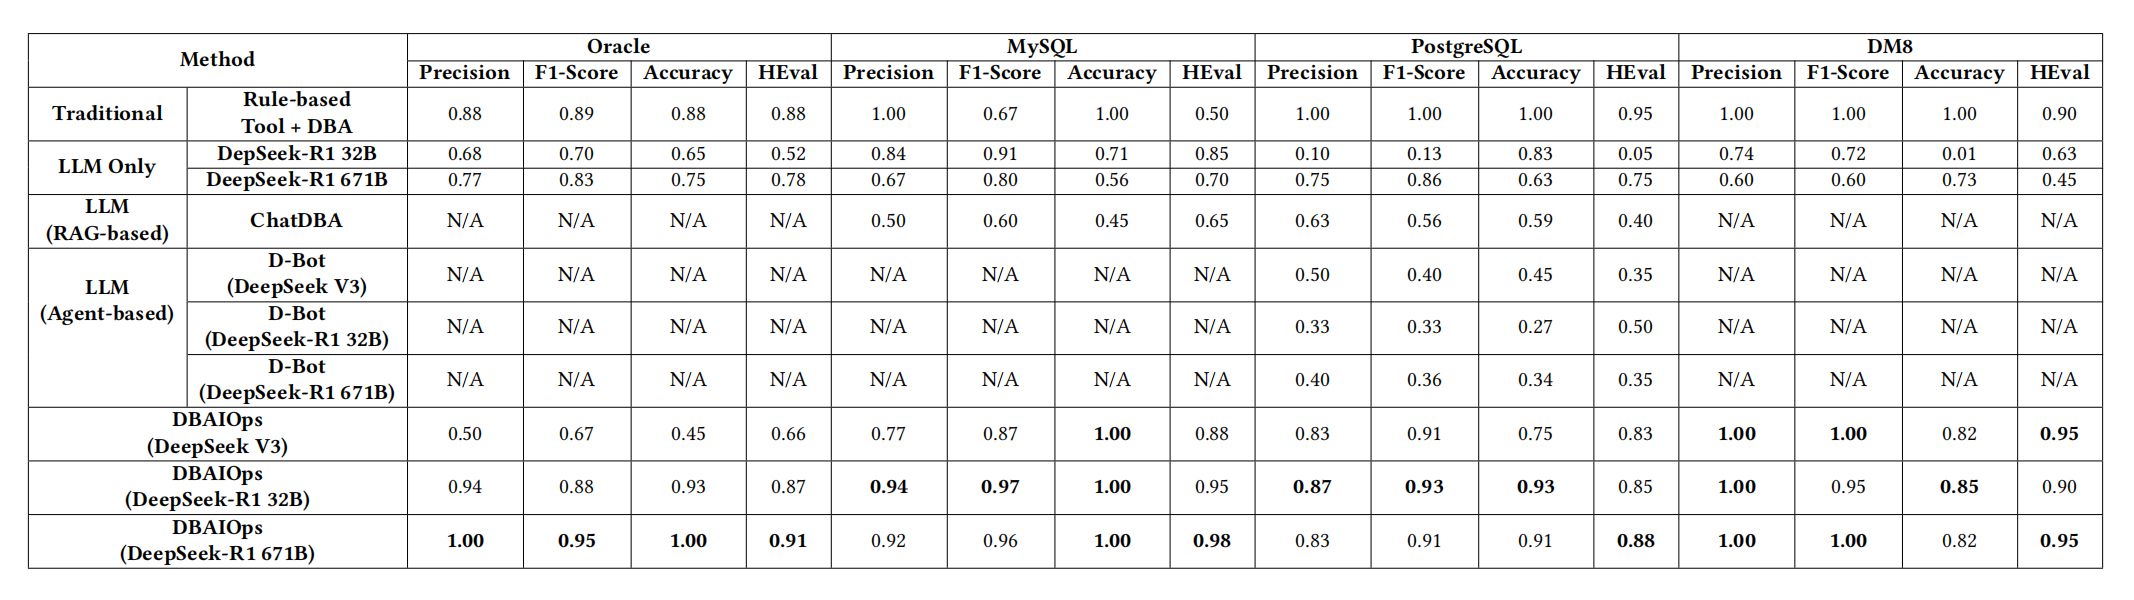
Impressive results. Notably, DBAIOps specifically emphasizes that mid-sized LLMs already produce good analysis results. This is important — DeepSeek-R1 671B running bare isn’t bad, but the cost is on a completely different level.
Nitpicking#
Can’t really be called “Ops” — it only has failure analysis functionality. Ops content is vast; failure analysis is just the tip of the iceberg.
Graph classification doesn’t match the graph example. The defined tag vertices and edges differ significantly from the example.
The vertices in the example play important roles, but these edge types aren’t defined: tag vertex-tool vertex, tag vertex-experience vertex, tag vertex-metric vertex. And the edges that should exist seem mostly absent, with only synonym edges present.
Undescribed parts of the example should be listed, otherwise it’s confusing.
- The two-stage graph evolution results are a bit odd:
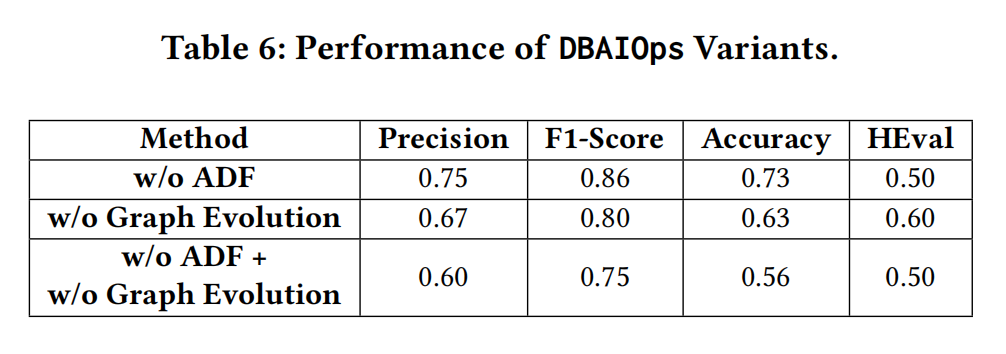
w/o ADF means without Stage 2 graph evolution (adaptive abnormal metric detection). w/o ADF should mean without Stage 1 graph evolution (graph inference and proximity discovery). w/o ADF means without either stage of graph evolution.
Here, the case with both stages of graph evolution is missing — having it would better demonstrate the effectiveness of two-stage graph evolution.
- Root causes are somewhat limited:
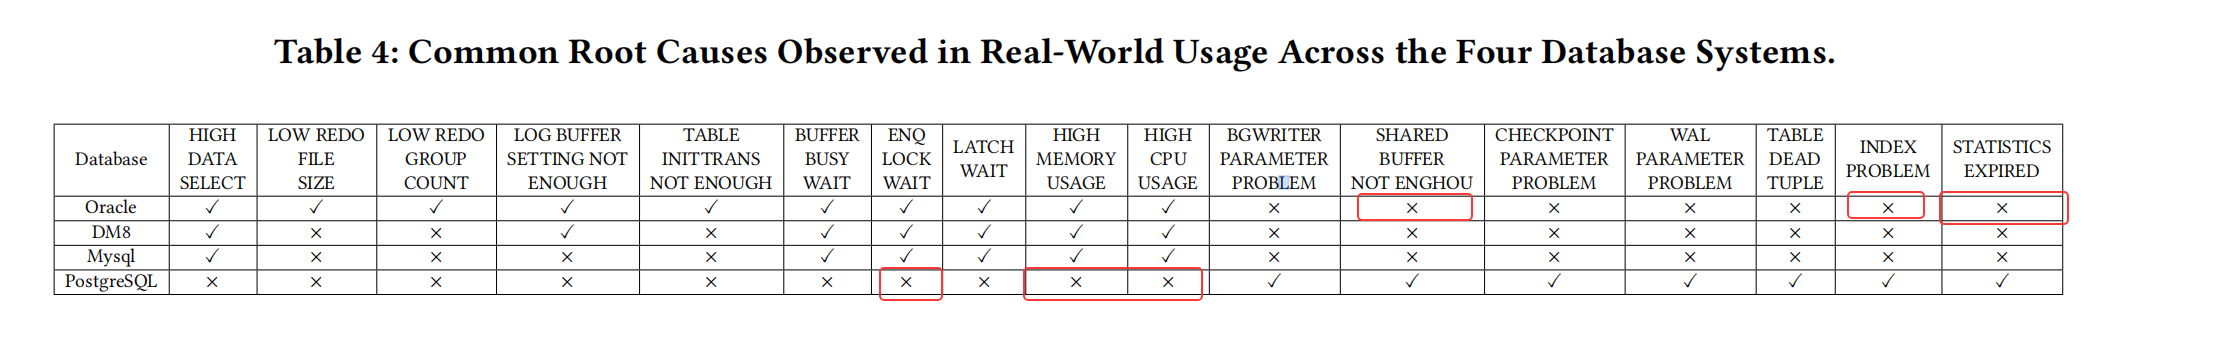
The circled ones should be relatively common (I only looked at Oracle and Postgres), but these root causes are currently absent.
PG’s root causes are a bit sparse. Dirty page flushing generally isn’t a major issue — as a root cause, it probably ranks behind many other root causes.
Summary#
Points I personally really like:
- GraphRAG should be better than vector RAG for failure diagnosis.
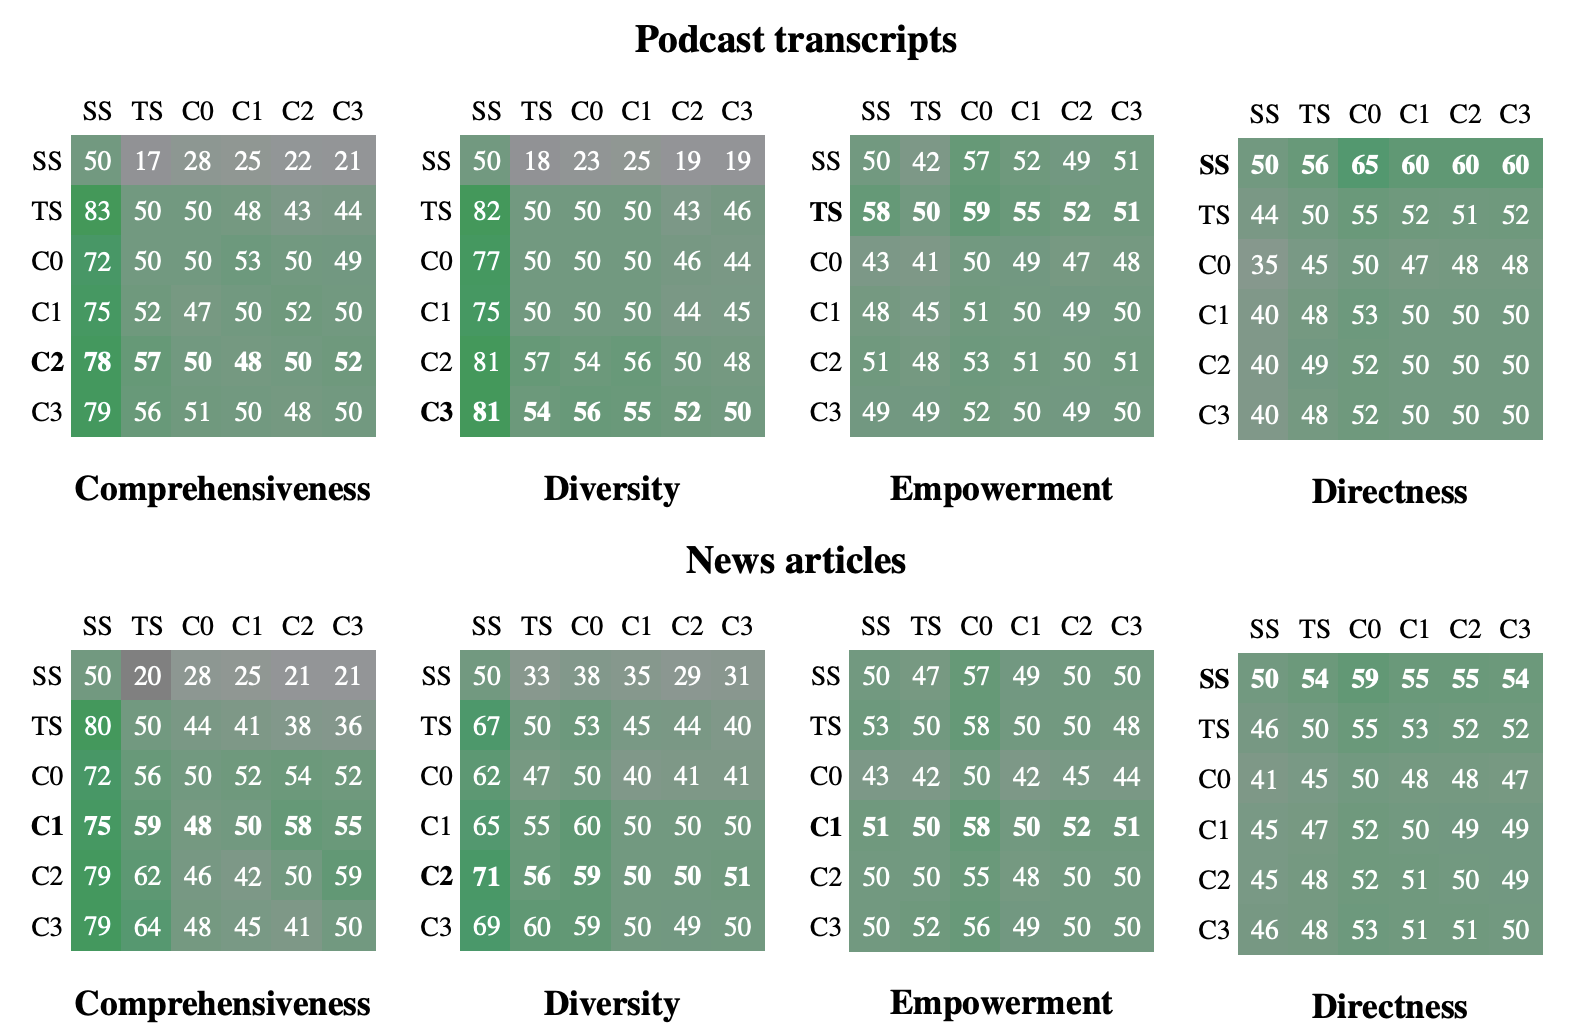
(GraphRAG original paper: From Local to Global: A GraphRAG Approach to Query-Focused Summarization)
SS represents vector RAG, TS represents source text summaries, and C0/C1/C2/C3 represent GraphRAG at different knowledge granularities. From this chart, we can simply conclude: GraphRAG is better suited for multi-document complex scenarios and multi-angle analysis, but may not necessarily outperform vector RAG in precision.
- Semi-automatic graph generation approach.
Graph generation is semi-automatic — trigger vertices are manually created, others can be auto-generated. For example, LOG FILE SYNC is a trigger vertex. Failure entry points can indeed be made into obvious anomaly points — these are the entry points. Same for PG, same for any failure — it aligns with human logic for understanding failures.
- Automatic graph evolution.
Strengthening associations between certain vertices is meaningful, as evident from the “Performance of DBAIOps Variants” table.
- Automatic baseline adjustment.
In Observability Engineering, there’s this passage about AIOps:
AI can only help when there are clearly discernible patterns and it can identify shifting baselines for prediction — such AIOps doesn’t exist yet.
DBAIOps in my eyes:
Clearly discernible patterns = DBAIOps’s graph, which includes failure models, anomaly relationships, monitoring data, and logs.
Shifting baselines = DBAIOps’s adaptive abnormal metric detection.
In summary, it’s a significant advancement over random chunking of failure knowledge, setting a single baseline, and vector approximate search in RAG models.
Original link: https://lastdba.com/2025/12/21/论文精读dbaio-ps/