This article focuses on common PostgreSQL operations issues — rare edge cases that surface once every two or three years are out of scope.
It’s primarily a technical ops summary, aiming for clarity and quick applicability. Deep dives at the source-code level are deliberately avoided.
SQL Performance & Execution Plans#
Sudden Execution Plan Changes#
PostgreSQL does not support optimizer hints natively, and the community has made it clear it never will. The PG community’s stance is roughly: “Our optimizer is perfect. If the current plan isn’t good enough, it’s because the developer doesn’t understand optimization.”
Regardless of what the PG community thinks, sudden execution plan regressions happen all the time in production, and we don’t have the rich, native plan-binding mechanisms that Oracle provides. This is a real challenge for production operations. For example: one morning, a sensitive query suddenly changes its plan, runtime jumps from 0.1s to 1s, and due to some concurrency the database CPU gets hammered — the business notices immediately. Without plan-binding tools, our only two rapid recovery options are: 1) collect statistics, or 2) scale up CPU.
A question about rapid recovery: does collecting statistics always help? A good DBA can identify where the optimizer went wrong, but can’t instantly conjure up a complete correct plan — especially for complex queries. Collecting statistics essentially hands the optimization problem back to the optimizer, trusting it to get it right. While this sounds a bit shaky, in PostgreSQL it actually works most of the time. (For scenarios where collecting stats is known to be useless, see the “ORDER BY LIMIT Problem” section.)
Why do execution plans suddenly change and regress?
- Plans are cost-based, costs rely on statistics, and statistics are always lagging
- Sufficiently complex SQL has a huge number of possible execution paths, and the optimizer picks the lowest-cost one
- PG exposes many optimizer parameters to tune for local hardware (e.g.,
seq_page_cost,effective_cache_size). These can nudge the optimizer’s preferences but are very low-level. While there’s theoretical tuning headroom, changing them has system-wide effects. After go-live, adjusting these is extremely high-risk. The very existence of these parameters hints that no plan can be 100% perfect, because the optimizer’s reasoning depends on its environment
Even mighty Oracle, with its arsenal of plan-stabilization features, can’t guarantee 100% problem-free SQL — because SQL, data, statistics, bind variables, etc. are all dynamic.
For PG users, we’re not there yet, but we can work on making plans more stable:
- Don’t join too many tables. More tables mean more possible plans — to the point where PG GEQO stops enumerating all plans, reducing the chance of finding the optimal one
- Don’t write overly complex SQL. Keep in mind SQL may come from ORM frameworks rather than hand-written queries. Framework-generated SQL is often optimized for a goal with little regard for brevity or readability, making it very hard to tune
- Don’t create indexes indiscriminately — have a clear goal. Random indexes confuse the optimizer
- Tune per-table statistics collection thresholds via
autovacuum_analyze_scale_factor(see “Delayed Statistics Collection”) - Use pg_hint_plan to give the optimizer hints
pg_hint_plan#
pg_hint_plan is a third-party extension that uses hints to guide the optimizer toward the correct plan.
What pg_hint_plan supports:
- Specifying scan methods (e.g., index scan), join methods (NL/HASH/MERGE), join order, memoize, estimated row counts, parallelism, and GUC parameters
- Binding hints to SQL via
hint_plan.hintswithout modifying the application SQL text
pg_hint_plan limitations:
- Usage restrictions with subqueries, foreign tables, CTEs, views, PL/pgSQL, etc.
compute_query_idtreats hints as comments and ignores them- Unknown bugs
While this extension is actively maintained, I haven’t found large-scale production deployment cases yet. We’ve also encountered issues in limited production use where hints don’t take effect — possibly related to JDBC plan caching — but it’s hard to draw firm conclusions.
In short: pg_hint_plan is a good tool, but large-scale production deployment is still TBD. I recommend waiting and watching. You can trial it, but don’t become dependent on it.
Delayed Statistics Collection#
Statistics are the foundation of SQL optimization. PG statistics aren’t particularly complex, but many people still don’t fully understand them.
The three key views for PG statistics: pg_class, pg_stat_all_tables, pg_stats
-- pg_class: pages and tuples
select relname,relpages,reltuples::bigint from pg_class where relname='lzlpg'\gx
-[ RECORD 1 ]------
relname   | lzlpg
relpages  | 187501
reltuples | 6000032

-- pg_stat_all_tables: live tuples, dead tuples, last analyze time
 select relname,n_live_tup,n_dead_tup,last_analyze,last_autoanalyze from pg_stat_all_tables where relname='lzlpg'\gx
-[ RECORD 1 ]----+------------------------------
relname          | lzlpg
n_live_tup       | 6000032
n_dead_tup       | 0
last_analyze     | 2025-01-04 15:54:44.553057+08
last_autoanalyze | [null]

-- pg_stats: per-column statistics — understand every field
 select *  from pg_stats where tablename='lzlpg' and attname='a'\gx
-[ RECORD 1 ]----------+-------
schemaname             | public
tablename              | lzlpg
attname                | a
inherited              | f
null_frac              | 0
avg_width              | 70
n_distinct             | -1
most_common_vals       | [null]
most_common_freqs      | [null]
histogram_bounds       | [null]
correlation            | [null]
most_common_elems      | [null]
most_common_elem_freqs | [null]
elem_count_histogram   | [null]
Stale statistics are very likely to cause execution plan changes and SQL performance issues.
Check last_autovacuum and last_autoanalyze in pg_stat_all_tables to determine if collection is lagging.
Why tune it? Because the default autovacuum_analyze_scale_factor is 0.1, meaning statistics are only collected when data changes exceed 10%. For a 1-billion-row table, that’s 100 million rows — possibly far too infrequent.
Evaluate whether to tune per-table autovacuum_vacuum_scale_factor and autovacuum_analyze_scale_factor based on: whether it’s a core business table, number of joins, query complexity, access frequency, month-boundary issues, data skew, etc. The goal: increase collection frequency to reduce plan-regression risk without wasting resources on excessive vacuuming.
What value should you set? An example:
For a monthly table (or monthly partition) with queries hitting the current day’s data: with autovacuum_analyze_scale_factor = 0.1, the table gets analyzed almost daily for the first ~10 days, but may skip analysis around day 12. At that point statistics can cross a boundary and plans may degrade. To ensure analysis continues through days 10–31 of the month, set autovacuum_analyze_scale_factor below 0.03. I recommend autovacuum_analyze_scale_factor = 0.02.
Parameter tuning reference (consider your table’s data model!):
| Parameter | Default | Recommended |
|---|---|---|
autovacuum_vacuum_scale_factor | 0.2 | 0.04 |
autovacuum_analyze_scale_factor | 0.1 | 0.02 |
The Optimizer May Choose a Non-Primary-Key Index#
Intuitively, a primary key should have the best selectivity, but the optimizer may still choose something else.
-- Reproduction commands
create table t1(a char(1000) primary key,b char(1000));
insert into t1 select md5(g::text),md5(g::text) from generate_series(1,10000) g;
create index idxa on t1(a);
create index idxb on t1(b);
analyze t1;

explain (analyze,buffers) select * from t1 where a='qwer' and b='qwer';
explain (analyze,buffers) select * from t1 where a='qwer' and b||''='qwer';
-- Columns a and b have identical selectivity, but the optimizer picks the regular index, not the PK
explain (analyze,buffers) select * from t1 where a='qwer' and b='qwer';
QUERY PLAN
------------------------------------------------------------------------------------------------------------
Index Scan using idxb on t1 (cost=0.41..5.43 rows=1 width=2008) (actual time=0.045..0.046 rows=0 loops=1)
Index Cond: (b = 'qwer'::bpchar)
Filter: (a = 'qwer'::bpchar)
Buffers: shared hit=3
-- Force the PK path — cost is only marginally higher
explain (analyze,buffers) select * from t1 where a='qwer' and b||''='qwer';
QUERY PLAN
------------------------------------------------------------------------------------------------------------
Index Scan using idxa on t1 (cost=0.41..5.44 rows=1 width=2008) (actual time=0.079..0.079 rows=0 loops=1)
Index Cond: (a = 'qwer'::bpchar)`
Filter: (((b)::text || ''::text) = 'qwer'::text)
Buffers: shared read=3Even though columns a and b have the same type and selectivity, the optimizer picks the regular index over the PK. The PK path costs 0.01 more.
Why does this matter?
With the current data distribution, picking the regular index is harmless. But once data changes, the two index plans can diverge dramatically:
alter table t1 set (autovacuum_enabled ='off');
insert into t1 select md5(g::text),'repeat' from generate_series(20001,30000) g;
-- b='repeat' has terrible selectivity, but the b index is still chosen
explain (analyze,buffers) select * from t1 where a='qwer' and b='repeat';
QUERY PLAN
--------------------------------------------------------------------------------------------------------------
Index Scan using idxb on t1 (cost=0.41..5.43 rows=1 width=2008) (actual time=15.823..15.824 rows=0 loops=1)
Index Cond: (b = 'repeat'::bpchar)
Filter: (a = 'qwer'::bpchar)
Rows Removed by Filter: 10000
Buffers: shared hit=2511
-- Compare with the PK plan
explain (analyze,buffers) select * from t1 where a='qwer' and b||''='repeat';
QUERY PLAN
------------------------------------------------------------------------------------------------------------
Index Scan using idxa on t1 (cost=0.41..5.44 rows=1 width=2008) (actual time=0.041..0.041 rows=0 loops=1)
Index Cond: (a = 'qwer'::bpchar)
Filter: (((b)::text || ''::text) = 'repeat'::text)
Buffers: shared hit=3Even with poor real selectivity, the optimizer sticks with the regular index — but efficiency is far worse (shared hit=2511 vs. shared hit=3). For latency-sensitive queries or larger data volumes, this becomes a real production problem.
Solutions:
- Manually collect statistics; increase collection frequency
- Use pg_hint_plan
- Rewrite the SQL to prevent it from using the regular index
The ORDER BY LIMIT Problem#
ORDER BY with LIMIT is a well-known issue with plenty of write-ups and case studies online (see my post ORDER BY LIMIT 10 Is Slower Than ORDER BY LIMIT 100).
The root cause: the optimizer currently can’t estimate where data sits in the table relative to the index order. If matching rows happen to be near the end of the table, the scan reads far more data than expected before returning the LIMIT rows. Note this isn’t limited to ORDER BY + LIMIT — any operation involving sorted output + LIMIT can hit it: GROUP BY + LIMIT, DISTINCT + LIMIT, merge joins, etc.
Solutions:
- Rewrite the SQL: add an expression to prevent using the sort-column index (including PK), e.g.,
order by ''||col1 limit xxx - Create a composite index: a composite index on (sort_column + index_column) may be chosen by the optimizer and is generally more efficient than an index on the sort column alone. This approach doesn’t require changing the SQL
Table Bloat#
Something Blocking Dead Tuple Cleanup#
Putting aside autovacuum configuration issues and edge cases, the common blockers are:
- Long-running transactions. Note: a long transaction on a different table also blocks dead-tuple reclamation. Read-only queries cause this too.
- Replication slots. Lagging or defunct replication slots cause this.
Both are relatively easy to solve: 1) terminate the long-transaction session, 2) drop the replication slot, or have the consumer analyze why consumption is so slow.
High-Concurrency UPDATE Causing Table Bloat#
Unlike something blocking vacuum, this is about dead tuples being generated faster than vacuum can clean them up. Typically, such tables show high pg_stat_all_tables.n_tup_upd. If table bloat requires repack, assess whether write volume is high enough to make repeated manual repack a losing game. In that case, tune the table/index fillfactor.
For the underlying principles, see this post From Painfully Slow Unique Index Scans to Index Bloat. I’ll summarize the conclusions here:
fillfactor basics:
fillfactor acts as a high-water mark for tables or indexes. During INSERT, once a page reaches its fillfactor line, new rows go to the next page. The purpose is to reserve space for UPDATEs so they don’t constantly seek new pages.
While both tables and indexes have fillfactor with the same goal (accommodating UPDATEs), the details differ significantly:
- Tables: If a page still has free space, an UPDATE can stay within the same page — no new page needed, no need to find another page with space. More importantly, thanks to PG’s HOT (Heap-Only Tuple) feature, in-page updates don’t touch indexes, naturally slowing index bloat
- Indexes: Different rows or out-of-page updates of the same row generate new index entries. Reserving space in index pages via fillfactor greatly reduces index page splits
Of course, fillfactor settings are tightly coupled with the workload. If data is append-only like logs with zero updates, fillfactor=100 for both tables and indexes is perfectly fine. But most business tables see updates, so fillfactor shouldn’t be 100. With frequent UPDATEs, it should be even lower.
Yet PG’s defaults are:
- Table default: fillfactor=100
- Index default: fillfactor=90
Recommended settings:
alter table lzlpg set (fillfactor=60);
alter index lzlpg_pkey set (fillfactor=70);
-- These commands only affect new pages; existing pages need repack

-- Repack:
1. Check for long transactions; resolve them first
2. nohup pg_repack -d lzldb --table lzlpg -p 6666 -no-kill-backend > pgrepack_lzlpg_log.log 2>&1 &
Long Transaction Problems#
Long transactions don’t have a huge amount of theory behind them — monitor and handle promptly — but they absolutely deserve their own section.
Long transactions cause many problems:
- Unreleased locks → application blocking
- WAL not recycled → disk alerts
- Dead tuples not cleaned → SQL performance degradation
- Various other bizarre performance issues linked to long transactions
- …
Long transactions in PostgreSQL are far more damaging than in Oracle or MySQL. They must be strictly managed.
Subtransaction Problems#
“Subtransactions are basically cursed. Rip em out.”
Subtransactions cause many problems and are a frequent pain point in the industry.
Industry experience reports:
Waiting for Postgres 17: Configurable SLRU cache sizes for increased performance
Subtransactions-overflow-and-the-performance-cliff
Why we spent the last month eliminating PostgreSQL subtransactions
Where subtransactions come from:
PL/pgSQLfunctions containing a block with an exception clausesavepoints- JDBC + autosave=always (default
autosave=never) - ODBC
Note: OGG uses an ODBC driver, and ODBC cannot disable subtransactions.
GaussDB’s ODBC can disable subtransactions via ForExtensionConnector.
So we can advise applications to keep subtransactions under 64, but we can’t easily advise against using OGG, since migrating off Oracle often depends on OGG-based data sync tools.
Subtransaction problem scenarios and symptoms:
- 1(+) long transaction + subtransaction overflow + high concurrency → severe performance drop
- Subtransaction overflow (64+) → noticeable performance dip
- Subtransaction overflow (64+) + multixact → severe performance drop
- 1(+) long transaction + 1(+) subtransaction → severe query performance drop on read replicas
Improvements in PG17:
SLRU manages transaction relationships for clog, multixact, subtrans, etc. in shared memory. Relevant source definitions:
/* Number of SLRU buffers to use for subtrans */
#define NUM_SUBTRANS_BUFFERS	32  // 32 SLRU pages in shared memory
/*
 * Each backend advertises up to PGPROC_MAX_CACHED_SUBXIDS TransactionIds
 * for non-aborted subtransactions of its current top transaction.  These
 * have to be treated as running XIDs by other backends.
 *
 * We also keep track of whether the cache overflowed (ie, the transaction has
 * generated at least one subtransaction that didn't fit in the cache).
 * If none of the caches have overflowed, we can assume that an XID that's not
 * listed anywhere in the PGPROC array is not a running transaction.  Else we
 * have to look at pg_subtrans.
 */
#define PGPROC_MAX_CACHED_SUBXIDS 64	// Overflow at 64+, per backend
PG17 SLRU improvements: New GUC parameter to configure SLRU slot count; split the existing single centralized SLRU lock into multiple bank locks.
Improvement effect:
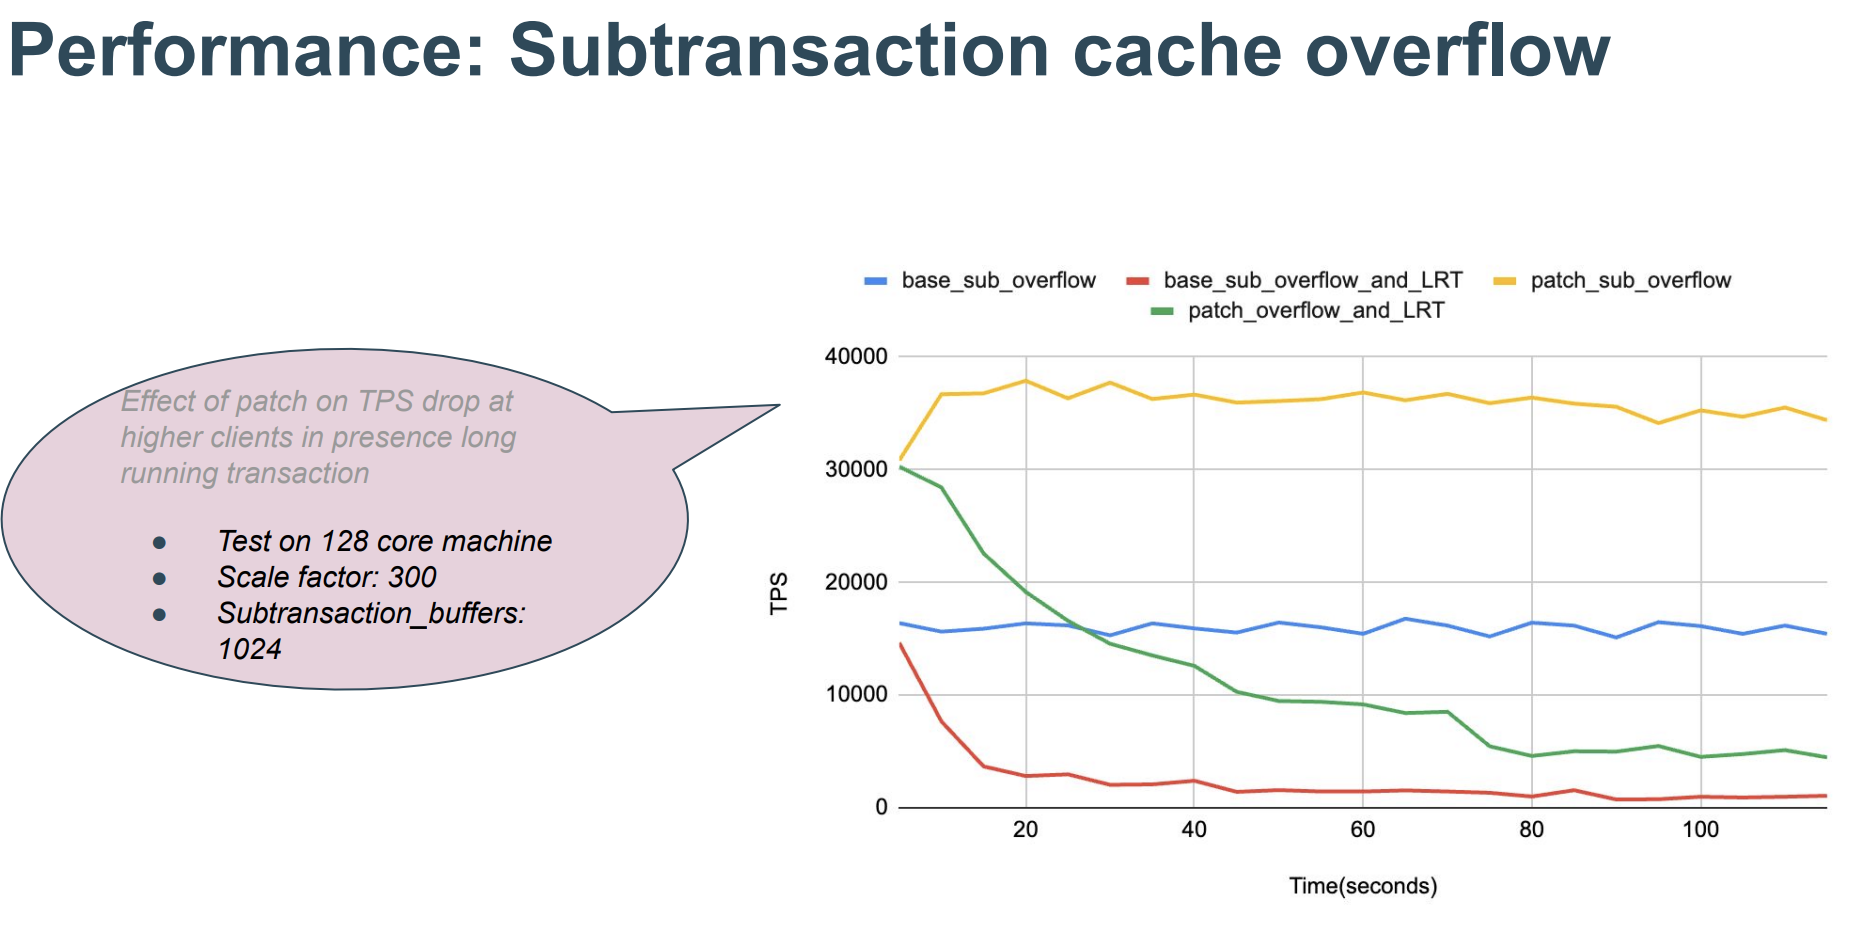 (
(Subtransaction handling strategies:
- Dev standards: Don’t use
savepoints; considerON CONFLICTfor write conflicts - Dev standards: Don’t use
exceptionblocks - Dev standards: Ensure JDBC does not have
autosave=alwaysenabled - Monitoring: Targeted monitoring of
pg_stat_slru - Monitoring: Targeted monitoring of
SAVEPOINTandEXCEPTION - CDC standards: Use ODBC (and OGG or other ODBC-based tools) with care; split transactions, cap subtransactions per large transaction at 50K
- Upgrade: Move to PG17
Concurrency & Performance#
Snapshot and Concurrency Parameter Tuning#
| Parameter | Type | Default | Recommended | Requires Restart |
|---|---|---|---|---|
old_snapshot_threshold | cpu | -1 (community) | -1 | Yes |
max_parallel_workers_per_gather | cpu | 2 | 0 | No |
old_snapshot_threshold easily causes performance problems when enabled — there’s plenty of material online. Even though it requires a restart, I strongly recommend keeping it disabled.
max_parallel_workers_per_gather auto-enables parallelism for large queries, but parallelism of 2 won’t give a proportional 2x speedup. This parameter is best used in specific scenarios, like explicitly setting parallel workers for batch jobs. Since no restart is needed, it’s a quick change.
Will disabling old_snapshot_threshold cause problems?
No. This parameter exists to limit long transactions — which do damage performance in PG — but the parameter itself causes performance issues, defeating the purpose.
Long transactions can be handled via several mechanisms:
- Long transaction monitoring. This is the most important, and monitoring is fairly mature.
- Set
statement_timeout(default 0) - Set
transaction_timeout(default 0, available in PG17+) - Set
lock_timeout(default 0; recommended at session level for DDL) - Set
idle_in_transaction_session_timeout(default 0; we set it to 2h) - Set
idle_session_timeout(default 0; not relevant here)
High-Concurrency Commits Causing LWLOCK:WALWrite#
Case Study: Intermittent Slow INSERT … VALUES
Key takeaways:
- There’s only one IO:WALWrite, but there can be dozens of LWLOCK:WALWrite waiters
- You can’t directly see the LWLOCK blocking chain, but from the source code we know LWLOCK:WALWrite is waiting on IO:WALWrite
- In high-concurrency small-transaction scenarios, increasing WAL buffer size theoretically doesn’t help much
What problems does this cause?
- Concurrent writes block, write latency increases, active sessions may spike
- High-concurrency small transactions can’t saturate disk IO
Solutions:
- Distribute concurrent writes across time
- Batch commits at the application level
- Analyze and try to reduce FPI (see FPI section)
- Group commit (TBD)
WAL & Latency#
FPI and Checkpoint Parameters#
PG generates WAL FPI (Full Page Images) the first time a page is touched after a checkpoint. So more frequent checkpoints → higher probability of FPI.
Checkpoint frequency is controlled by two parameters:
checkpoint_timeoutmax_wal_size
Principle:
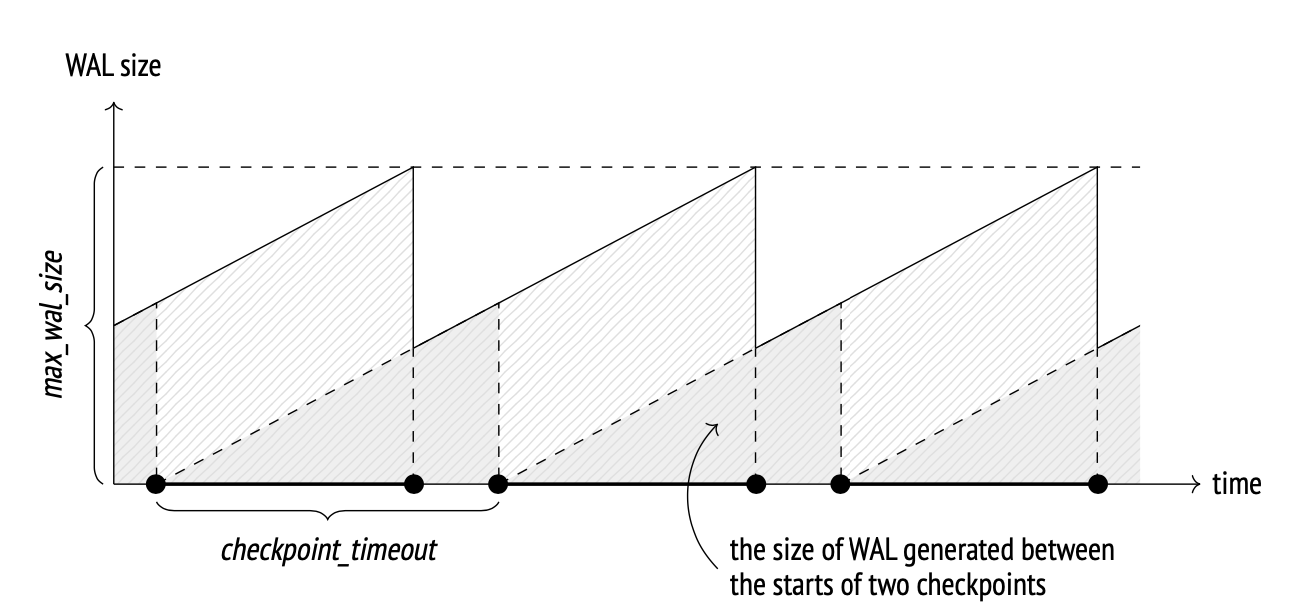 (Egor Rogov, PostgreSQL 14 Internals)
max_wal_size defaults to 1GB, which is too small for high-load databases. Generally, you should increase this parameter to reduce FPI.
checkpoint_timeout defaults to 5 minutes, which seems reasonable.
FPI and Random Writes#
Even with longer checkpoint intervals, FPI problems may persist. Check whether the workload involves UUID-based random writes. You may need to switch to sequences or another UUID scheme.
Finding the specific index:
- Check if FPI is severe
--stats=record is handy
pg_waldump -z --stats=record 00000001000001860000001B- Sort which relations have the most FPWs
pg_waldump 00000001000001860000001B|grep FPW|awk -F ':' '{print $7}'|awk '{print $2}'|sort -n|uniq -c |sort -r|head -10Logical Replication & Replication Slots#
Logical replication has many issues and is a key optimization area for the community — nearly every major version brings significant improvements.
Logical Replication and Replication Slots Basics
Spill Problem#
Analysis of PG Startup Logic and Spill-Induced Slow Startup
Spill key takeaways:
- Spill occurs when logical decoding can’t fit transaction data in memory, so it writes to disk. Spill files contain transaction information
- Each walsender has independent decoding, so each logical replication subscriber has its own spill
- Large transactions produce large spill files, typically few in number
- Subtransaction spill produces one spill file per subtransaction
Versions:
- PG12 and earlier: hard-coded 4096 changes
- PG13 added
logical_decoding_work_memto adjust memory and reduce spill probability - PG14+ supports streaming replication
- Streaming also requires certain conditions to trigger, so even with streaming, spilling can still occur
- PG17 added
debug_logical_replication_streamingto force streaming
WALSender Blocking Shutdown#
PG Shutdown Logic and WALSender Blocking Shutdown Analysis
In reality, any process that doesn’t exit can block shutdown. The question is which ones are most likely to cause trouble. From the shutdown code flow, archiver and walsender are frequent blockers because during shutdown they attempt a final archive or log transmission.
- If shutdown is stuck on walsender, try
kill(notkill -9) — the checkpoint hasn’t finished yet, and a forced shutdown leaves an inconsistent state. Even for forced shutdown, preferpg_ctl stop -D $PGDATA -m iover rawkill -9 - If shutdown is stuck on archiver,
kill -9is fine — the checkpoint is already complete and the database is in a consistent state
Partitioned Tables#
PG’s partitioned tables have unique characteristics that developers generally don’t fully understand without study, leading to many pitfalls.
Index Mismatch Between Parent and Child Partitions#
Due to non-standard partition creation, many indexes are created directly on child tables (which should not be done), and the “create index on all children + attach” workflow is skipped. The result: the parent table has no index or no effective index. Since the parent has no data, this doesn’t directly impact queries — but when new partitions are created, they only inherit the parent’s indexes, so new child tables end up missing indexes.
Fixing parent-table missing indexes is fairly straightforward: see The Correct Way to Create Partition Indexes
-- Create an invalid index ONLY on the parent. Fast, but blocks subsequent DML — watch for long transactions
CREATE INDEX IDX_DATECREATED ON ONLY lzlpartition1(date_created);
-- Create the index CONCURRENTLY on each child partition. Slow, but doesn't block DML — watch for long DML transactions that could cause the operation to fail
create index concurrently idx_datecreated_202302 on  lzlpartition1_202302(date_created);
-- Attach all indexes. Fast, no business blocking
 ALTER INDEX idx_datecreated ATTACH PARTITION idx_datecreated_202302;
Fixing a missing primary key on the parent is harder: see Adding Primary Keys and Unique Indexes to Partitioned Tables
Adding a primary key on the parent acquires AccessExclusiveLock, blocking everything. Creating an index on a partitioned table is slow, and the PK then causes further blocking. There’s currently no low-impact way to add a PK on a partitioned table. Workarounds: “attach a unique index + NOT NULL constraint”, schedule extended downtime for the partition table while the index builds, or use a third-party sync tool to populate a new table that already has the PK.
Abusing the DEFAULT Partition#
Default Partition Overgrowth Causing Prolonged Blocking During CREATE TABLE ... PARTITION OF
The root cause is simple: when adding a new partition, the DDL must validate that data in the DEFAULT partition doesn’t conflict with the new partition’s range. This scans a large amount of data in the DEFAULT partition, and the new partition creation never completes. Blocking then cascades — business queries and writes stall.
DEFAULT partition abuse is a widespread problem! The community PG doesn’t provide interval partitioning. If a developer forgets to create a partition, data silently lands in DEFAULT with no error or alert. Day after day, the DEFAULT partition grows enormous — and then the next schema change causes an outage.
You can’t leave an oversized DEFAULT partition as-is forever. Even though ATTACH can avoid the blocking problem, you still need to defuse this bomb eventually.
DEFAULT partition data handling — Plan 1:
- DETACH the default partition, create proper partitions, then re-insert DEFAULT data into the partitioned table
- If needed, after detach and creating proper partitions, create an empty DEFAULT partition to maintain business continuity
- Note: DETACH (unlike ATTACH) requires an AccessExclusiveLock on the parent. PG14 supports DETACH CONCURRENTLY, but not for DEFAULT partitions
DEFAULT partition data handling — Plan 2:
- DETACH the default partition, create proper partitions, then ATTACH the detached DEFAULT table as a regular child partition — careful with range boundaries
- If needed, after detach and creating proper partitions, create an empty DEFAULT partition to maintain business continuity
- Note: DETACH (unlike ATTACH) requires an AccessExclusiveLock on the parent. PG14 supports DETACH CONCURRENTLY, but not for DEFAULT partitions
DEFAULT partition data handling — Plan 3:
- Create a new table, sync all data via DTS
- Rename tables
Plan 3 looks the crudest, but it’s the one I personally recommend most. If you have 5 instances to fix, a surgical approach is fine. If you have 200 instances, the labor cost makes DTS the practical winner.
Missing SELECT Privileges on Partitions Causing Abnormal Plans#
If a user lacks SELECT privilege on a child partition, their queries can’t access that partition’s statistics, leading to bad execution plans. Partitions created via CREATE TABLE ... PARTITION OF normally don’t carry SELECT grants — but data is accessible through the parent — so this is a widespread issue.
Solutions:
- Have the cloud platform handle it automatically
- Enforce dev standards requiring SELECT grants on child partitions
High-Concurrency Full Partition Scans and LWLock:lockmanager#
This is another very common problem!
I recommend reading the AWS documentation, which explains it clearly: https://docs.aws.amazon.com/AmazonRDS/latest/UserGuide/wait-event.lw-lock-manager.html
Symptoms:
- Spiking active sessions
- Severe LWLock:lockmanager wait events
- Database performance cliff
Trigger conditions:
- Query scans multiple partitions
- That query has high concurrency
Key takeaways:
- The fastpath lock mechanism is designed for quick access to “weak locks”, improving database concurrency
- fastpath works for lock levels ≤ 3 — i.e., SELECT, SELECT FOR xxx, and DML (lock modes below
ShareUpdateExclusiveLock— levels 1, 2, 3 can use fastpath). It’s meant to benefit normal operations FP_LOCK_SLOTS_PER_BACKEND: a local process holds at most 16 fastpath locks; beyond that, it must acquire locks in shared memory, producingLWLock:lockmanager- Not just tables — every accessed index also acquires a lock
- This problem isn’t tightly coupled to partition count — even a modest number of partitions can trigger
LWLock:lockmanagerand degrade performance
Let’s calculate: with a partitioned table having 1 primary key and 2 regular indexes, how many partitions exhaust the fastpath?
16 / (3 indexes + 1 table) - 1 parent = 3 child partitionsYes — a full scan across just 3 partitions can already trigger LWLock:lockmanager waits.
For a regular table, 16 indexes would similarly exhaust fastpath.
Solutions:
- For not-too-large tables, merge partitions into a regular table
- Add partition key filter conditions to queries
- Reduce indexes (not very practical, since partition count alone can exceed 16)
The hard part:
In Oracle-to-PG migrations, Oracle supports global indexes, so primary keys and unique indexes don’t need to include the partition key. In PG, they must include the partition key.
PK example:
idxlzl(primarykey)  --oracle
idxlzl(primarykey,partitionkey)  --pg
A common query pattern:
select col from tlzl where primarykey=12345;Should you push the application to add a partition filter here? It’s a tough sell. The resistance is: “I already passed the primary key — what more do you want? If I knew everything, why would I query the database?”
In this case, the only recommendation is to convert the partitioned table to a regular table. I haven’t found a better solution.
Memory#
Excessive Objects Leading to Oversized relcache#
Key takeaways:
- relcache stores relation metadata: OID, pg_class info, partitions, subtransactions, row-level security policies, statistics, index metadata, access methods, etc.
- Each session has its own (rel)cache for system catalog data (metadata, etc.)
- Normally this cache is small. When the catalog is huge and a session accesses all of it, the cache can become very large
- Cache management is simple: no eviction mechanism, no limit (though there are invalidation messages)
- Closing the session releases the cache
Solutions:
- Reduce the number of objects — especially check whether partition child tables are excessive
- Set aggressive connection-pool disconnection parameters so business connections recycle more frequently
Memory Fragmentation#
Recommended commands:
cat /proc/meminfo|grep whatyouneed
cat  /proc/buddyinfo

## cgroup memory
/opt/cgtools/cginfo -t perf -s mem

# Pay attention to pgscand/s (direct memory reclaim) — values in the tens of thousands indicate a problem
sar -B -s "08:00:00" -e "09:00:00"
# min_free_kbytes setting:
cat /proc/sys/vm/min_free_kbytes
# Total physical memory usage of all processes:
grep Pss /proc/[1-9]*/smaps | awk '{total+=$2}; END {printf "%d kB\n", total }'
# PSS memory for a specific process:
cat /proc/90875/smaps |grep Pss |awk '{sum+=$2 };END {print sum/1024}'
# RSS memory for a specific process:
cat /proc/68729/smaps |grep Rss |awk '{sum+=$2 };END {print sum/1024}'
# Private memory for a specific process:
cat /proc/90875/smaps|sed '/zero/,/VmFlags/d' |grep Private |awk '{sum+=$2 };END {print sum/1024}'
min_free_kbytes:
(https://vivani.net/2022/06/14/linux-kernel-tuning-page-allocation-failure/)
When free memory is low, the kswapd daemon is woken to free pages:
- pages_low: when free pages fall below pages_low, buddy allocator wakes kswapd and the kernel begins swapping pages to disk
- pages_min: when free pages reach pages_min, reclamation pressure is high — the zone urgently needs free pages. The allocator performs synchronous kswapd work, sometimes called direct reclaim
- pages_high: once kswapd is awake and freeing pages, the kernel considers the zone “balanced” only when free pages reach pages_high. At pages_high, kswapd goes back to sleep. Free pages above pages_high means the zone is in an ideal state
vm.min_free_kbytes (the pages_min watermark) is an extremely important OS parameter. Too low a value prevents effective memory reclamation, potentially causing system crashes and service interruptions. Too high a value increases reclaim activity, causing allocation delays that can immediately trigger OOM.
Optimization results:
After increasing min_free_kbytes + deploying off-peak drop-cache jobs, problems have decreased significantly.
Why increase min_free_kbytes?
This is used to force the Linux VM to keep a minimum number of kilobytes free. The VM uses this number to compute a watermark[WMARK_MIN] value for each lowmem zone in the system. Each lowmem zone gets a number of reserved free pages based proportionally on its size.
The point of raising min_free_kbytes isn’t to raise the min watermark and trigger direct reclaim more often — it’s because the low watermark couldn’t be tuned before Linux 7. The only way to raise low proportionally was to raise min, making asynchronous reclaim trigger earlier and giving direct reclaim a buffer window.
Red Hat 8 added two memory parameters to improve reclaim: watermark_scale_factor can raise watermarks without touching min_free_kbytes.
Recommend enabling huge pages:
- Huge pages perform better when PG requests contiguous memory
- Huge pages also help reduce page cache size
- shared_buffers can use huge pages; requires
Huge_pages=onand OS-level huge pages enabled - Instances with huge pages enabled in production show better performance and fewer problems
- AWS huge pages standard: enabled by default for all instance classes except certain test tiers, and cannot be disabled
Huge_pagesparameter is turned on by default for all DB instance classes other than t3.medium, db.t3.large, db.t4g.medium, db.t4g.large instance classes. You can’t change thehuge_pagesparameter value or turn off this feature in the supported instance classes of Aurora PostgreSQL.
cgroup and Host Memory Mismatch#
When cgroup memory hits its limit, kswapd prioritizes reclaiming pages within the cgroup. With cloud VM instance types and cgroup configurations, the host may have free memory above watermarks while the cgroup is under pressure. The host-level pages_low doesn’t trigger asynchronous reclaim for either host or cgroup memory. Eventually, direct reclaim fires to satisfy the cgroup’s DB memory demand.
The root cause: cgroups lack independent free-page memory management.
The only fix: increase the cgroup memory limit, overcommitting the host more aggressively so the host reaches pages_low sooner.
shared_buffer and pagecache#
PG uses a double-buffer mechanism — no direct IO yet.
Double buffer: DB shared_buffers (one layer of shared memory) + OS pagecache (another layer). In real deployments, pagecache is typically far larger than shared_buffers. And pagecache counts against cgroup mem but isn’t reflected in cgroup memory monitoring…
Bottom line: leave plenty of memory for pagecache. Don’t make shared_buffers excessively large (20GB seems sufficient for most cases). Only increase it if you clearly observe buffer-mapping-related wait events.
work_mem Cannot Cap Hash Join / Hash Aggregate Memory#
hash_mem_multiplier limits memory for hash-based operations (hash join, hash agg, etc.), capping at hash_mem_multiplier * work_mem. The default is 2.
Before PG13, work_mem was tunable, but there was no way to limit how many hash operations a single query could use. PG13 added this multiplier. In other words, pre-13, it was very hard to cap hash-table memory.
In a PG12- production environment, I found a single session consuming 300GB of memory — the culprit was the lack of hash-table limits combined with a plan that incorrectly used hash tables.
Other Issues#
Exclusive Backup and Startup Issues#
Normally, when the database stops and restarts, the startup position comes from pg_controldata’s LSN. But if there’s a backup_label file in PGDATA, the startup LSN is read from backup_label.
What problems does this cause?
- Disk snapshots taken directly on the data directory may include the label file. If the database is large and the backup took a long time, restart can be very slow
- Bigger problem: after a production shutdown from certain causes, restart takes forever. The root cause is the startup LSN coming from the backup rather than controldata
Version changes:
PG13:
pg_start_backup()
pg_stop_backup()
Supports exclusive and non-exclusive modes; exclusive is the default. Exclusive mode creates backup_label in the data directory at start and cleans it at stop. Non-exclusive mode doesn’t create the label at start; it returns the label info at stop.
PG15:
pg_backup_start()
pg_backup_stop()
Function names changed, and exclusive backup mode was removed. No backup_label is written at backup start; instead it’s written to the backup area at backup stop.
pg_stat_activity Unqueryable#
Symptom:
pg_stat_activity hangs and can’t be queried.
pstack at the time:
#0  pgstat_read_current_status () at pgstat.c:3642
#1  0x0000000000727181 in pgstat_read_current_status () at pgstat.c:2788
#2  pgstat_fetch_stat_numbackends () at pgstat.c:2789
#3  0x000000000083f2ee in pg_stat_get_activity (fcinfo=0x25c2d98) at pgstatfuncs.c:575
#4  0x000000000065058f in ExecMakeTableFunctionResult (setexpr=0x25b1d28, econtext=0x25b1c48, argContext=<optimized out>, expectedDesc=0x2545218, randomAccess=false) at execSRF.c:234
#5  0x00000000006609dc in FunctionNext (node=node@entry=0x25b1b38) at nodeFunctionscan.c:94
#6  0x000000000065110c in ExecScanFetch (recheckMtd=0x660700 <FunctionRecheck>, accessMtd=0x660720 <FunctionNext>, node=0x25b1b38) at execScan.c:133
Analysis:
The code location is clear — stuck in an infinite loop after st_changecount becomes odd.
Triggers: OOM (reproducible), abnormal backend exit (possible), terminate (maybe). None of these guarantee the issue, though.
Community thread didn’t reach a conclusion. Currently the trigger probability appears low.
Solution: restart the database.
Connection and Connection Pooling Issues#
IO Error Messages#
IO errors typically mean the application is using a connection that’s already been closed. This happens often, and diagnosing it is difficult because the entire chain involves many components and broad domain knowledge. Here’s a brief summary.
Known active-disconnection scenarios:
- hikari
maxLifetime
Symptom: session lifetime matches the parameter. Possible cause: the application holds an explicit transaction with an uncommitted SELECT, the pool closes the session, and the app gets io error; could not rollback or similar.
pg.datasouce.maxLifetime- druid timeout
Symptom: connection drops after SQL execution exceeds 20s.
spring.datasource.dynamic.druid.socketTimeout=20000
spring.datasource.dynamic.druid.connectTimeout=20000
Change to:
spring.datasource.socketTimeout=3600000
spring.datasource.connectTimeout=3600000
Application Horizontal Scaling vs. Database Connection Limits#
Horizontal application scaling meets PG connection bottlenecks:
HikariCP is now Spring Boot’s default connection pool. With the proliferation of Spring Boot and microservices, HikariCP usage is widespread. Every pod scaled out increases database connection count. The maximumPoolSize stays the same per pod, but more nodes mean more total connections. From existing node count, added node count, and current total connections, you can proportionally calculate how many idle connections will be added.
Applications can scale horizontally without state, but databases cannot. PG’s connection limit is max_connections. Unchecked application scaling can saturate idle connections. Tuning max_connections is painful because it requires a database restart.
PG connection upper limit:
Also, even with unlimited horizontal scaling, max_connections should adjust with instance class — but there’s a real ceiling. In any database, idle connections degrade performance as they increase.
Refer to AWS’s approach:
max_connections is tied to instance class, with a maximum of 5000, LEAST({DBInstanceClassMemory/9531392}, 5000). This reduces manual connection ops and provides a reasonable ceiling.