Problem Analysis Overview#
The database kept OOMing. Analysis revealed the issue was in query plan generation: planning time ~1 second, planning shared hits ~1 million. After thorough investigation, the root cause was identified as bloat in the statistics base table pg_statistic. On the first SQL execution of a session — due to a CatCacheMiss — the backend accessed and cached an excessive amount of dead tuple data from pg_statistic. Application connections always spawned new sessions, and the combined memory usage across multiple backends was too large, leading to OOM.
Below is the detailed analysis process.
Problem Symptoms#
A certain database kept OOMing and restarting. After investigation, we found that while the number of concurrent sessions wasn’t high, each session’s memory footprint was quite large. The total memory exceeded the cgroup memory limit, causing OOM.
We could preliminarily rule out the following causes:
- Not caused by excessive metadata. Too many objects (typically too many partitions) would cause sessions to cache excessive metadata. This database didn’t have that many objects.
- Not caused by SQL execution plan issues. Sorting/hash operations might use too much memory. This database didn’t fit that scenario — the SQL in question was a simple sequential scan.
During the investigation, we discovered that any simple SQL query in this database took a very long time to execute, and Planning Buffers showed about 1 million hits:
 explain (analyze,buffers,timing) select * from  lzlinfo limit 1;
                                                     QUERY PLAN
--------------------------------------------------------------------------------------------------------------------
 Limit  (cost=0.00..1.02 rows=1 width=71) (actual time=0.011..0.012 rows=1 loops=1)
   Buffers: shared hit=1
   ->  Seq Scan on lzlinfo  (cost=0.00..480.73 rows=473 width=71) (actual time=0.010..0.010 rows=1 loops=1)
         Buffers: shared hit=1
 Planning:
   Buffers: shared hit=1127312   -- Abnormal planning shared hit
 Planning Time: 947.038 ms  -- Abnormal planning time
 Execution Time: 0.035 ms
(8 rows)
Running the same SQL a second time, the planning time was normal.
Problem Investigation Process#
Printing Execution Plan Statistics#
We enabled logging for each phase of the execution plan:
set log_parser_stats   =on;
set log_planner_stats  =on;
set log_executor_stats   =on;
Then ran the SQL. The log output was as follows:
2024-08-13 10:02:33.936 CST,"postgres","lzldb",85532,"[local]",66babe8c.14e1c,13,"idle",2024-08-13 10:01:48 CST,4/713,0,LOG,00000,"PARSER STATISTICS","! system usage stats:
!       0.000046 s user, 0.000046 s system, 0.000091 s elapsed
!       [0.001661 s user, 0.001661 s system total]
!       4660 kB max resident size
!       0/0 [0/8] filesystem blocks in/out
!       0/36 [0/996] page faults/reclaims, 0 [0] swaps
!       0 [0] signals rcvd, 0/0 [0/0] messages rcvd/sent
!       0/0 [5/0] voluntary/involuntary context switches",,,,,"explain (analyze,buffers) select *,1 from  lzlinfo
2024-08-13 10:02:33.938 CST,"postgres","lzldb",85532,"[local]",66babe8c.14e1c,14,"EXPLAIN",2024-08-13 10:01:48 CST,4/713,0,LOG,00000,"PARSE ANALYSIS STATISTICS","! system usage stats:
!       0.001459 s user, 0.000000 s system, 0.001464 s elapsed
!       [0.003146 s user, 0.001687 s system total]
!       5972 kB max resident size
!       0/0 [0/8] filesystem blocks in/out
!       0/325 [0/1324] page faults/reclaims, 0 [0] swaps
!       0 [0] signals rcvd, 0/0 [0/0] messages rcvd/sent
!       0/0 [5/0] voluntary/involuntary context switches",,,,,"explain (analyze,buffers) select *,1 from  lzlinfo
2024-08-13 10:02:33.938 CST,"postgres","lzldb",85532,"[local]",66babe8c.14e1c,15,"EXPLAIN",2024-08-13 10:01:48 CST,4/713,0,LOG,00000,"REWRITER STATISTICS","! system usage stats:
!       0.000001 s user, 0.000000 s system, 0.000001 s elapsed
!       [0.003177 s user, 0.001687 s system total]
!       5972 kB max resident size
!       0/0 [0/8] filesystem blocks in/out
!       0/0 [0/1324] page faults/reclaims, 0 [0] swaps
!       0 [0] signals rcvd, 0/0 [0/0] messages rcvd/sent
!       0/0 [5/0] voluntary/involuntary context switches",,,,,"explain (analyze,buffers) select *,1 from  lzlinfo
2024-08-13 10:02:34.644 CST,"postgres","lzldb",85532,"[local]",66babe8c.14e1c,16,"EXPLAIN",2024-08-13 10:01:48 CST,4/713,0,LOG,00000,"PLANNER STATISTICS","! system usage stats:
!       0.539964 s user, 0.164083 s system, 0.705718 s elapsed
!       [0.543248 s user, 0.165770 s system total]
!       745072 kB max resident size   -- Abnormal point
!       0/0 [0/8] filesystem blocks in/out
!       0/184803 [0/186157] page faults/reclaims, 0 [0] swaps
!       0 [0] signals rcvd, 0/0 [0/0] messages rcvd/sent
!       0/1 [5/1] voluntary/involuntary context switches",,,,,"explain (analyze,buffers) select *,1 from  lzlinfo
2024-08-13 10:02:34.644 CST,"postgres","lzldb",85532,"[local]",66babe8c.14e1c,17,"EXPLAIN",2024-08-13 10:01:48 CST,4/713,0,LOG,00000,"EXECUTOR STATISTICS","! system usage stats:
!       0.540248 s user, 0.164170 s system, 0.706088 s elapsed
!       [0.543532 s user, 0.165857 s system total]
!       745596 kB max resident size
!       0/0 [0/8] filesystem blocks in/out
!       0/184898 [0/186252] page faults/reclaims, 0 [0] swaps
!       0 [0] signals rcvd, 0/0 [0/0] messages rcvd/sent
!       0/1 [5/1] voluntary/involuntary context switches",,,,,"explain (analyze,buffers) select *,1 from  lzlinfo
"
During the planner phase, memory usage skyrocketed and elapsed time also spiked. This pinpointed the issue to the planner phase within the overall planning stage. There wasn’t much else actionable from the stats.
strace Tracing#
strace -p 76419strace: Process 76419 attached
epoll_wait(4, [{EPOLLIN, {u32=15422552, u64=15422552}}], 1, -1) = 1
recvfrom(9, "Q\0\0\0\262explain (analyze,buffers) s"..., 8192, 0, NULL, NULL) = 179
lseek(5, 0, SEEK_END) = 8192
brk(NULL) = 0xfed000
brk(0x100e000) = 0x100e000
brk(NULL) = 0x100e000
brk(NULL) = 0x100e000
brk(0x1007000) = 0x1007000
brk(NULL) = 0x1007000
mmap(NULL, 270336, PROT_READ|PROT_WRITE, MAP_PRIVATE|MAP_ANONYMOUS, -1, 0) = 0x2b7806b0c000
open("base/17076/16678", O_RDWR) = 7
lseek(7, 0, SEEK_END) = 0
open("base/17076/46160", O_RDWR) = 12
lseek(12, 0, SEEK_END) = 7667712
open("base/17076/46168", O_RDWR) = 13
lseek(13, 0, SEEK_END) = 188416
open("base/17076/46170", O_RDWR) = 14
lseek(14, 0, SEEK_END) = 188416
mmap(NULL, 528384, PROT_READ|PROT_WRITE, MAP_PRIVATE|MAP_ANONYMOUS, -1, 0) = 0x2b78c1b36000
brk(NULL) = 0x1007000
brk(0x102c000) = 0x102c000
brk(NULL) = 0x102c000
brk(NULL) = 0x102c000
brk(0x1025000) = 0x1025000
brk(NULL) = 0x1025000
lseek(12, 0, SEEK_END) = 7667712
open("pg_stat_tmp/pgss_query_texts.stat", O_RDWR|O_CREAT, 0600) = 15
pwrite64(15, "explain (analyze,buffers) select"..., 172, 93934) = 172
pwrite64(15, "\0", 1, 94106) = 1
close(15) = 0
sendto(8, "\2\0\0\0\250\3\0\0\264B\0\0\10\0\0\0\1\0\0\0\0\0\0\0\0\0\0\0\0\0\0\0"..., 936, 0, NULL, 0) = 936
sendto(8, "\2\0\0\0\250\3\0\0\264B\0\0\10\0\0\0\0\0\0\0\0\0\0\0\0\0\0\0\0\0\0\0"..., 936, 0, NULL, 0) = 936
sendto(8, "\2\0\0\0\250\3\0\0\264B\0\0\10\0\0\0\0\0\0\0\0\0\0\0\0\0\0\0\0\0\0\0"..., 936, 0, NULL, 0) = 936
sendto(8, "\2\0\0\0\250\3\0\0\264B\0\0\10\0\0\0\0\0\0\0\0\0\0\0\0\0\0\0\0\0\0\0"..., 936, 0, NULL, 0) = 936
sendto(8, "\2\0\0\0\250\3\0\0\264B\0\0\10\0\0\0\0\0\0\0\0\0\0\0\0\0\0\0\0\0\0\0"..., 936, 0, NULL, 0) = 936
sendto(8, "\2\0\0\0\10\1\0\0\264B\0\0\2\0\0\0\0\0\0\0\0\0\0\0\0\0\0\0\0\0\0\0"..., 264, 0, NULL, 0) = 264
sendto(8, "\2\0\0\0\10\1\0\0\0\0\0\0\2\0\0\0\0\0\0\0\0\0\0\0\0\0\0\0\0\0\0\0"..., 264, 0, NULL, 0) = 264
sendto(8, "\16\0\0\0H\0\0\0\6\0\0\0\0\0\0\0\0\0\0\0\0\0\0\0\1\0\0\0\0\0\0\0"..., 72, 0, NULL, 0) = 72
sendto(9, "T\0\0\0#\0\1QUERY PLAN\0\0\0\0\0\0\0\0\0\0\31\377\377\377\377"..., 826, 0, NULL, 0) = 826
recvfrom(9, 0xd2b4e0, 8192, 0, NULL, NULL) = -1 EAGAIN (Resource temporarily unavailable)
epoll_wait(4, Although there were many shared hits, strace didn’t reveal much. strace showed the session only opened 4 data files. Using fd and oid2name to look up the data files, they turned out to be: the table, two indexes on the table, and pathman_config:
From database "lzldb":
  Filenode                  Table Name
--------------------------------------
     46170  ix_name
     46168  pk_lzlinfo
     46160  lzlinfo
     16678  pathman_config
These objects are not large, so it didn’t look like oversized tables (or indexes) were the cause.
perf#
(No screenshot — use your imagination.)
The perf flame graph showed ~40% of the time spent on the heap_hot_search_buffer stack.
gdb#
Using heap_hot_search_buffer as a clue, after multiple gdb sessions, we set the following breakpoints to investigate:
b relation_open
b get_relation_info
b RelationCacheInvalidateEntry
b get_relname_relid
b AcceptInvalidationMessages
b RelationClearRelation
b pg_hint_plan_planner
b heap_hot_search_buffer
When breakpoints first hit, there was a lot of noise — they were normal logic. But later, after execution reached a certain point, only heap_hot_search_buffer kept hitting:
Breakpoint 15, heap_hot_search_buffer (tid=tid@entry=0x2313c60, relation=0x2b2141663910, buffer=17045, snapshot=snapshot@entry=0x228a058, heapTuple=heapTuple@entry=0x23273d0,
    all_dead=all_dead@entry=0x7ffce272e28f, first_call=true) at heapam.c:1503
1503    in heapam.c
(gdb)
Continuing.
...

Breakpoint 15, heap_hot_search_buffer (tid=tid@entry=0x2313c60, relation=0x2b2141663910, buffer=96708, snapshot=snapshot@entry=0x228a058, heapTuple=heapTuple@entry=0x23273d0,
    all_dead=all_dead@entry=0x7ffce272e28f, first_call=true) at heapam.c:1503
1503    in heapam.c
Most arguments passed to heap_hot_search_buffer remained unchanged — including the addresses of relation and heapTuple — only the buffer parameter changed, indicating it was scanning the same relation.
heapTuple contained table OID information. Let’s print it:
(gdb) p *heapTuple
$46 = {
  t_len = 968,
  t_self = {
    ip_blkid = {
      bi_hi = 0,
      bi_lo = 7211
    },
    ip_posid = 5
  },
  t_tableOid = 2619,   -- This is useful
  t_data = 0x2b2155fced00
heap_hot_search_buffer was called with OID=2619. Looking up 2619 in pg_class, it’s pg_statistic:
select oid,relname from pg_class where oid in (2619)
  oid  |             relname
-------+----------------------------------
  2619 | pg_statistic
Accessing the statistics base table is expected — PG needs statistics to estimate costs when generating candidate execution plans.
pg_statistic Bloat#
Now that we’ve pinpointed pg_statistic, let’s check its condition:
>  \dt+ pg_statistic
                                 List of relations
   Schema   |     Name     | Type  |  Owner   | Persistence |  Size   | Description
------------+--------------+-------+----------+-------------+---------+-------------
 pg_catalog | pg_statistic | table | postgres | permanent   | 1036 MB |


> select * from pg_class where relname='pg_statistic'\gx
-[ RECORD 1 ]-------+------------------------------------------------
oid                 | 2619
relname             | pg_statistic
relnamespace        | 11
reltype             | 12016
reloftype           | 0
relowner            | 10
relam               | 2
relfilenode         | 2619
reltablespace       | 0
relpages            | 132481
reltuples           | 4655
pg_statistic is 1GB — certainly oversized. 132,481 blocks but only 4,655 rows — this is clearly table bloat. But even with bloat, does accessing statistics really require caching the entire pg_statistic table? Logically, no — you only need the statistics for the specific table. And indeed, PG accesses pg_statistic through its primary key index pg_statistic_relid_att_inh_index. From the call stack below, we can see the composite primary key fields being passed:
bt
...
#6  0x000000000086edbc in SearchCatCacheMiss (cache=cache@entry=0x226ba80, nkeys=nkeys@entry=3, hashValue=hashValue@entry=853716409, hashIndex=hashIndex@entry=57, v1=v1@entry=18767, v2=v2@entry=1,
    v3=v3@entry=0, v4=v4@entry=0) at catcache.c:1368
#7  0x000000000086fa82 in SearchCatCacheInternal (v4=0, v3=<optimized out>, v2=<optimized out>, v1=<optimized out>, nkeys=3, cache=0x226ba80) at catcache.c:1299
#8  SearchCatCache3 (cache=0x226ba80, v1=v1@entry=18767, v2=v2@entry=1, v3=v3@entry=0) at catcache.c:1183
#9  0x0000000000880d70 in SearchSysCache3 (cacheId=cacheId@entry=58, key1=key1@entry=18767, key2=key2@entry=1, key3=key3@entry=0) at syscache.c:1145
#10 0x0000000000874092 in get_attavgwidth (relid=relid@entry=18767, attnum=1) at lsyscache.c:2991
#11 0x00000000006a2d46 in set_rel_width (root=root@entry=0x2326600, rel=rel@entry=0x21e8418) at costsize.c:5516
...
The call passes relid=relid@entry=18767, attnum=1:
 select ctid,starelid,staattnum from pg_statistic where starelid=18767;
    ctid    | starelid | staattnum
------------+----------+-----------
 (132657,6) |    18767 |         1
 (132657,7) |    18767 |         2
 (132657,8) |    18767 |         3
 (132657,9) |    18767 |         4
 (132658,1) |    18767 |         5
 (132658,2) |    18767 |         6
 (132658,3) |    18767 |         7
 (132658,4) |    18767 |         8
 (132658,5) |    18767 |         9
 (132658,6) |    18767 |        10
 -- lzlinfo has 10 columns total, each with a staattnum entry
From the ctid, we can see this data actually lives in just 2 blocks.
Now let’s access pg_statistic via the composite primary key index. Even with data in only 2 blocks, it took 1 second to access with ~1 million (1,141,568) shared hits:
 explain (analyze,buffers,timing,verbose) select ctid,starelid from pg_statistic where starelid=18767;
                                                                             QUERY PLAN
--------------------------------------------------------------------------------------------------------------------------------------------------------------------
 Index Scan using pg_statistic_relid_att_inh_index on pg_catalog.pg_statistic  (cost=0.41..103.31 rows=23 width=10) (actual time=105.416..1035.723 rows=10 loops=1)
   Output: ctid, starelid
   Index Cond: (pg_statistic.starelid = '18767'::oid)
   Buffers: shared hit=1141568  -- Abnormal
 Planning:
   Buffers: shared hit=8
 Planning Time: 0.102 ms
 Execution Time: 1035.802 ms
Accessing 10 rows in pg_statistic via the index resulted in ~1M shared hits — roughly matching the ~1M planning shared hits from the original SQL. (Note: Planning Time here is minimal, meaning the issue is not in plan generation per se, but in the data access during planning.)
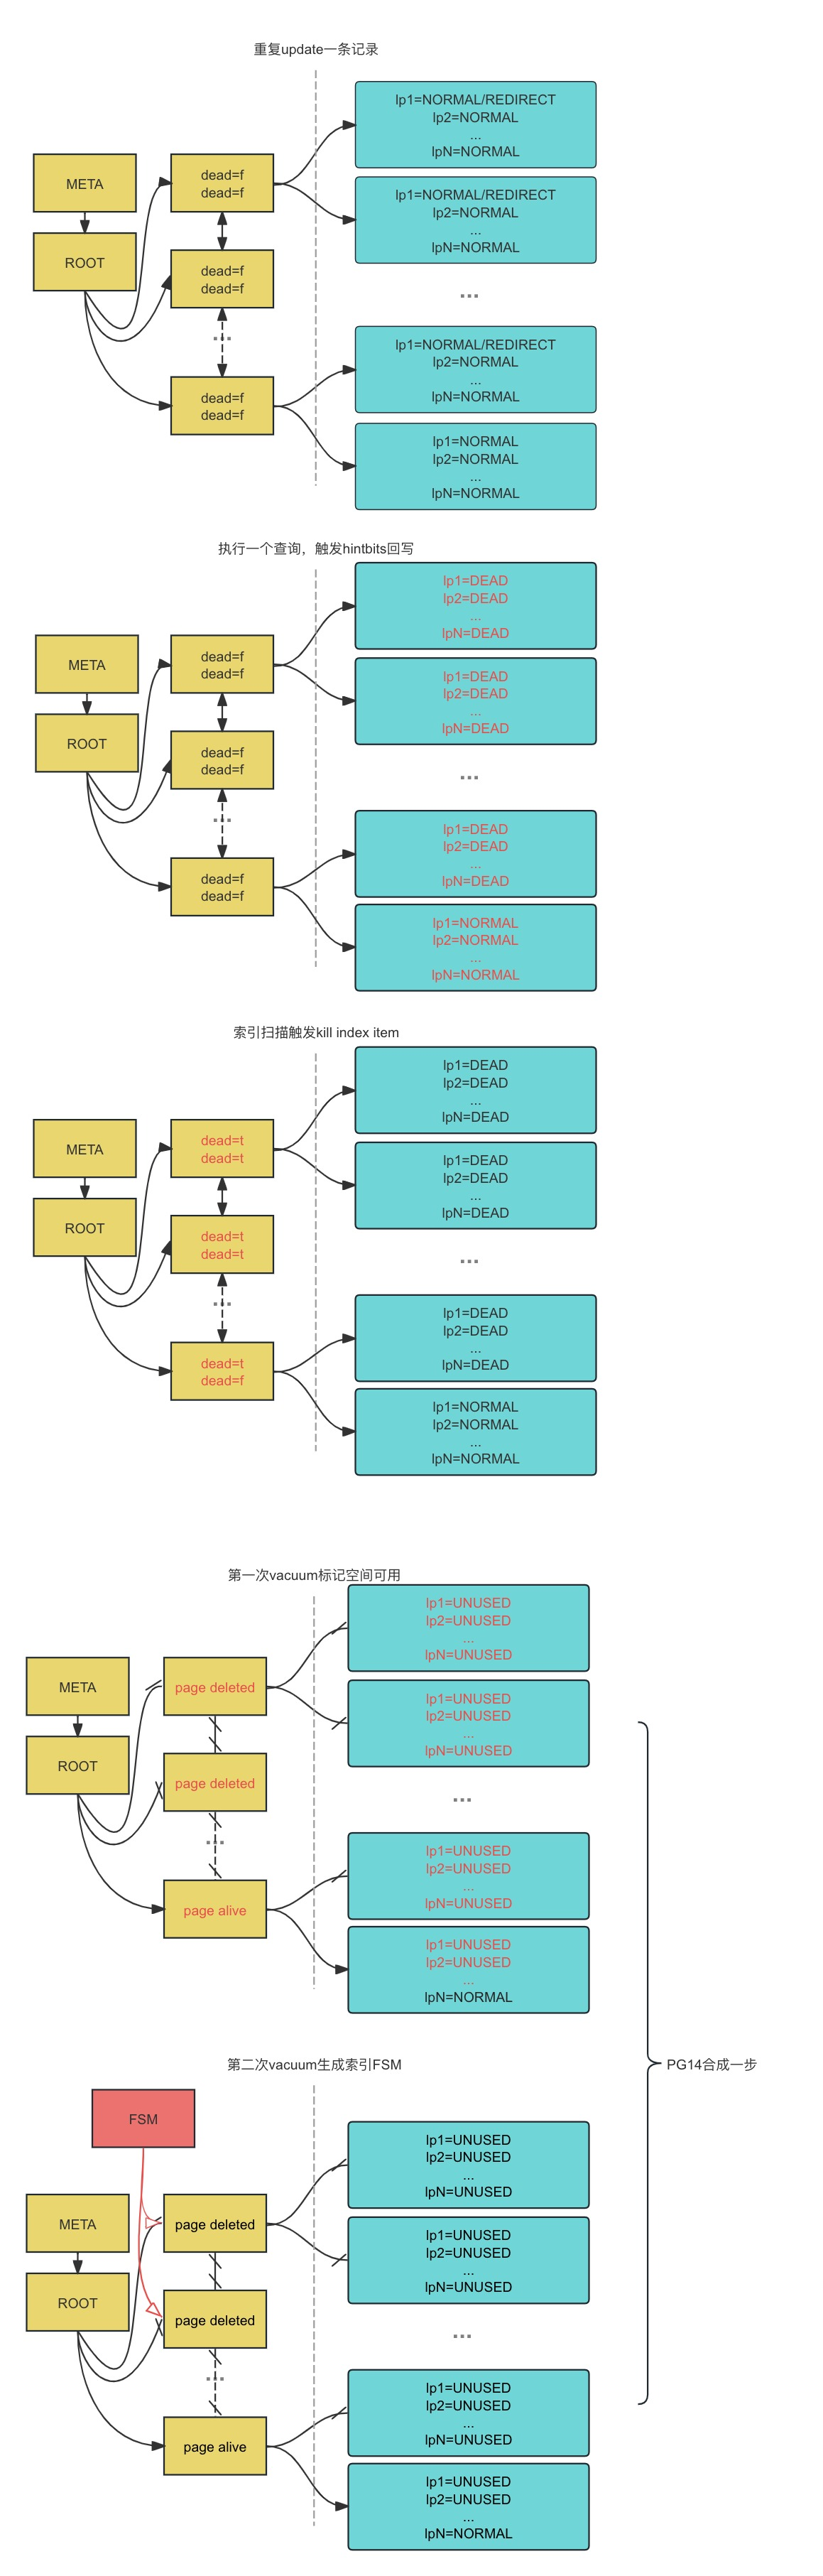
Index Dead Tuples#
If vacuum hasn’t truly “run properly”, index dead tuples still point to dead heap tuples.
Refer to: From Very Slow Unique Index Scans to Index Bloat
autovacuum Not Reclaiming Dead Tuples#
With such severe table bloat, shouldn’t autovacuum have reclaimed it?
select * from pg_stat_all_tables where relname='pg_statistic'\gx
-[ RECORD 1 ]-------+------------------------------
relid               | 2619
schemaname          | pg_catalog
relname             | pg_statistic
seq_scan            | 1  	    -- Very few sequential scans on pg_statistic
seq_tup_read        | 4655
idx_scan            | 28715508  -- Many index scans on pg_statistic
idx_tup_fetch       | 25150245
n_tup_ins           | 46
n_tup_upd           | 1292143   -- Lots of updates
n_tup_del           | 14
n_tup_hot_upd       | 138448
n_live_tup          | 4655
n_dead_tup          | 1496776
n_mod_since_analyze | 1292203
n_ins_since_vacuum  | 0
last_vacuum         | [null]
last_autovacuum     | 2024-08-16 20:34:15.045022+08  -- Note: autovacuum timestamp is recent
last_analyze        | [null]
last_autoanalyze    | [null]
vacuum_count        | 0
autovacuum_count    | 144170
analyze_count       | 0
autoanalyze_count   | 0
Actually, autovacuum was constantly running on pg_statistic, but the worker process may not have been visible because it finished quickly (having nothing to actually reclaim) and went back to naptime:
show autovacuum_naptime ;
 autovacuum_naptime
--------------------
 1min
It naps every 1 minute, and the logs show autovacuum info printed every 1 minute as well:
2024-08-16 21:05:15.267 CST,,,41080,,66bf4e87.a078,1,,2024-08-16 21:05:11 CST,27/166839,0,LOG,00000,"automatic vacuum of table ""lzldb.pg_catalog.pg_statistic"": index scans: 0
pages: 0 removed, 132685 remain, 1 skipped due to pins, 0 skipped frozen
tuples: 0 removed, 1501745 remain, 1497090 are dead but not yet removable, oldest xmin: 119329380
buffer usage: 265443 hits, 0 misses, 0 dirtied
avg read rate: 0.000 MB/s, avg write rate: 0.000 MB/s
system usage: CPU: user: 0.53 s, system: 0.17 s, elapsed: 3.38 s
WAL usage: 1 records, 0 full page images, 233 bytes",,,,,,,,,"","autovacuum worker"
2024-08-16 21:05:17.474 CST,,,41080,,66bf4e87.a078,2,,2024-08-16 21:05:11 CST,27/166844,136438968,LOG,00000,"automatic analyze of table ""lzldb.public.lzlinfo"" system usage: CPU: user: 2.02 s, system: 0.00 s, elapsed: 2.08 s",,,,,,,,,"","autovacuum worker"
"
1497090 are dead but not yet removable — although autovacuum was triggered, it didn’t reclaim any dead tuples at all. 1,497,090 dead tuples remained uncleaned.
Investigating who held oldest xmin: 119329380, we quickly identified a replication slot:
select * from pg_replication_slots;
    slot_name    |  plugin  | slot_type | datoid | database | temporary | active | active_pid |  xmin  | catalog_xmin | restart_lsn  | confirmed_flush_lsn | wal_status | safe_wal_size
-----------------+----------+-----------+--------+----------+-----------+--------+------------+--------+--------------+--------------+---------------------+------------+---------------
 slotslotlostname | pgoutput | logical   |  17076 | lzldb   | f         | f      |     [null] | [null] |    119329380 | 3F9/105A4970 | 3F9/105F8778        | extended   |        [null]
The slot’s catalog_xmin=119329380 matched the vacuum’s oldest xmin: 119329380.
active=f indicated that the replication link was already broken.
Fixing the Problem#
Drop the replication slot:
select pg_drop_replication_slot('slotslotlostname');
 pg_drop_replication_slot
--------------------------
Then manually vacuum or wait 1 minute for autovacuum.
Finally, open a brand-new session to verify the fix:
## psql
psql (13.2)
Type "help" for help.

> \c lzldb
You are now connected to database "lzldb" as user "postgres".
> explain (analyze,buffers,timing) select * from  lzlinfo limit 1;
                                                     QUERY PLAN
---------------------------------------------------------------------------------------------------------------------
 Limit  (cost=0.00..8.04 rows=1 width=71) (actual time=0.023..0.025 rows=1 loops=1)
   Buffers: shared hit=1
   ->  Seq Scan on lzlinfo  (cost=0.00..3802.73 rows=473 width=71) (actual time=0.018..0.018 rows=1 loops=1)
         Buffers: shared hit=1
 Planning:
   Buffers: shared hit=2578
 Planning Time: 9.605 ms
 Execution Time: 0.098 ms
Planning time dropped from ~1 second to ~10 ms, and planning shared hits dropped from ~1M to ~2K. The problem was basically resolved.
Case Summary#
The replication link broke and the replication slot wasn’t cleaned up in time, leading to bloat in the pg_statistic statistics base table. This caused each backend to be very slow when loading statistics for the first time and to read excessive pages into its local cache. Each backend’s cache exceeded normal levels (~2GB), and with multiple backends this led to OOM.
The problem itself is simple — it was just the investigation that was convoluted. In short: bloat in the base table pg_statistic caused excessive data access during the plan generation phase. Metadata base table bloat can cause other tricky problems too — until next time.