Analyzing Slow CREATE TABLE.. PARTITION OF Statements#
2024-05-16 22:02:59.063 CST,"user1","dblzl",125889,"30.88.79.3:37423",66461213.1ebc1,2,"authentication",2024-05-16 22:02:59 CST,34/41364668,0,LOG,00000,"connection authorized: user=user1 database=dblzl",,,,,,,,,"","client backend"
2024-05-16 22:02:59.079 CST,"user1","dblzl",125889,"30.88.79.3:37423",66461213.1ebc1,3,"idle",2024-05-16 22:02:59 CST,34/41364669,0,LOG,00000,"statement:  -- a86fae372f73414bbe1af18213a47beb
/*a86fae372f73414bbe1af18213a47beb */
create table if not exists table1_partition_p2406 partition of table1 for values from ('2024-06-01 00:00:00') to ('2024-07-01 00:00:00'); ",,,,,,,,,"","client backend"
...
2024-05-16 22:38:28.555 CST,"user1","dblzl",125889,"30.88.79.3:37423",66461213.1ebc1,4,"CREATE TABLE",2024-05-16 22:02:59 CST,34/0,0,LOG,00000,"duration: 2129483.549 ms",,,,,,,,,"","client backend"
The user ‘user1’ connected to the database at 22:02:59 and immediately executed a create table.. partition of.. statement, which didn’t complete until 22:38:28. The logs in between are omitted — there was a lot of session blocking information, with session 125889 as the blocking source.
Blocked sessions looked like:
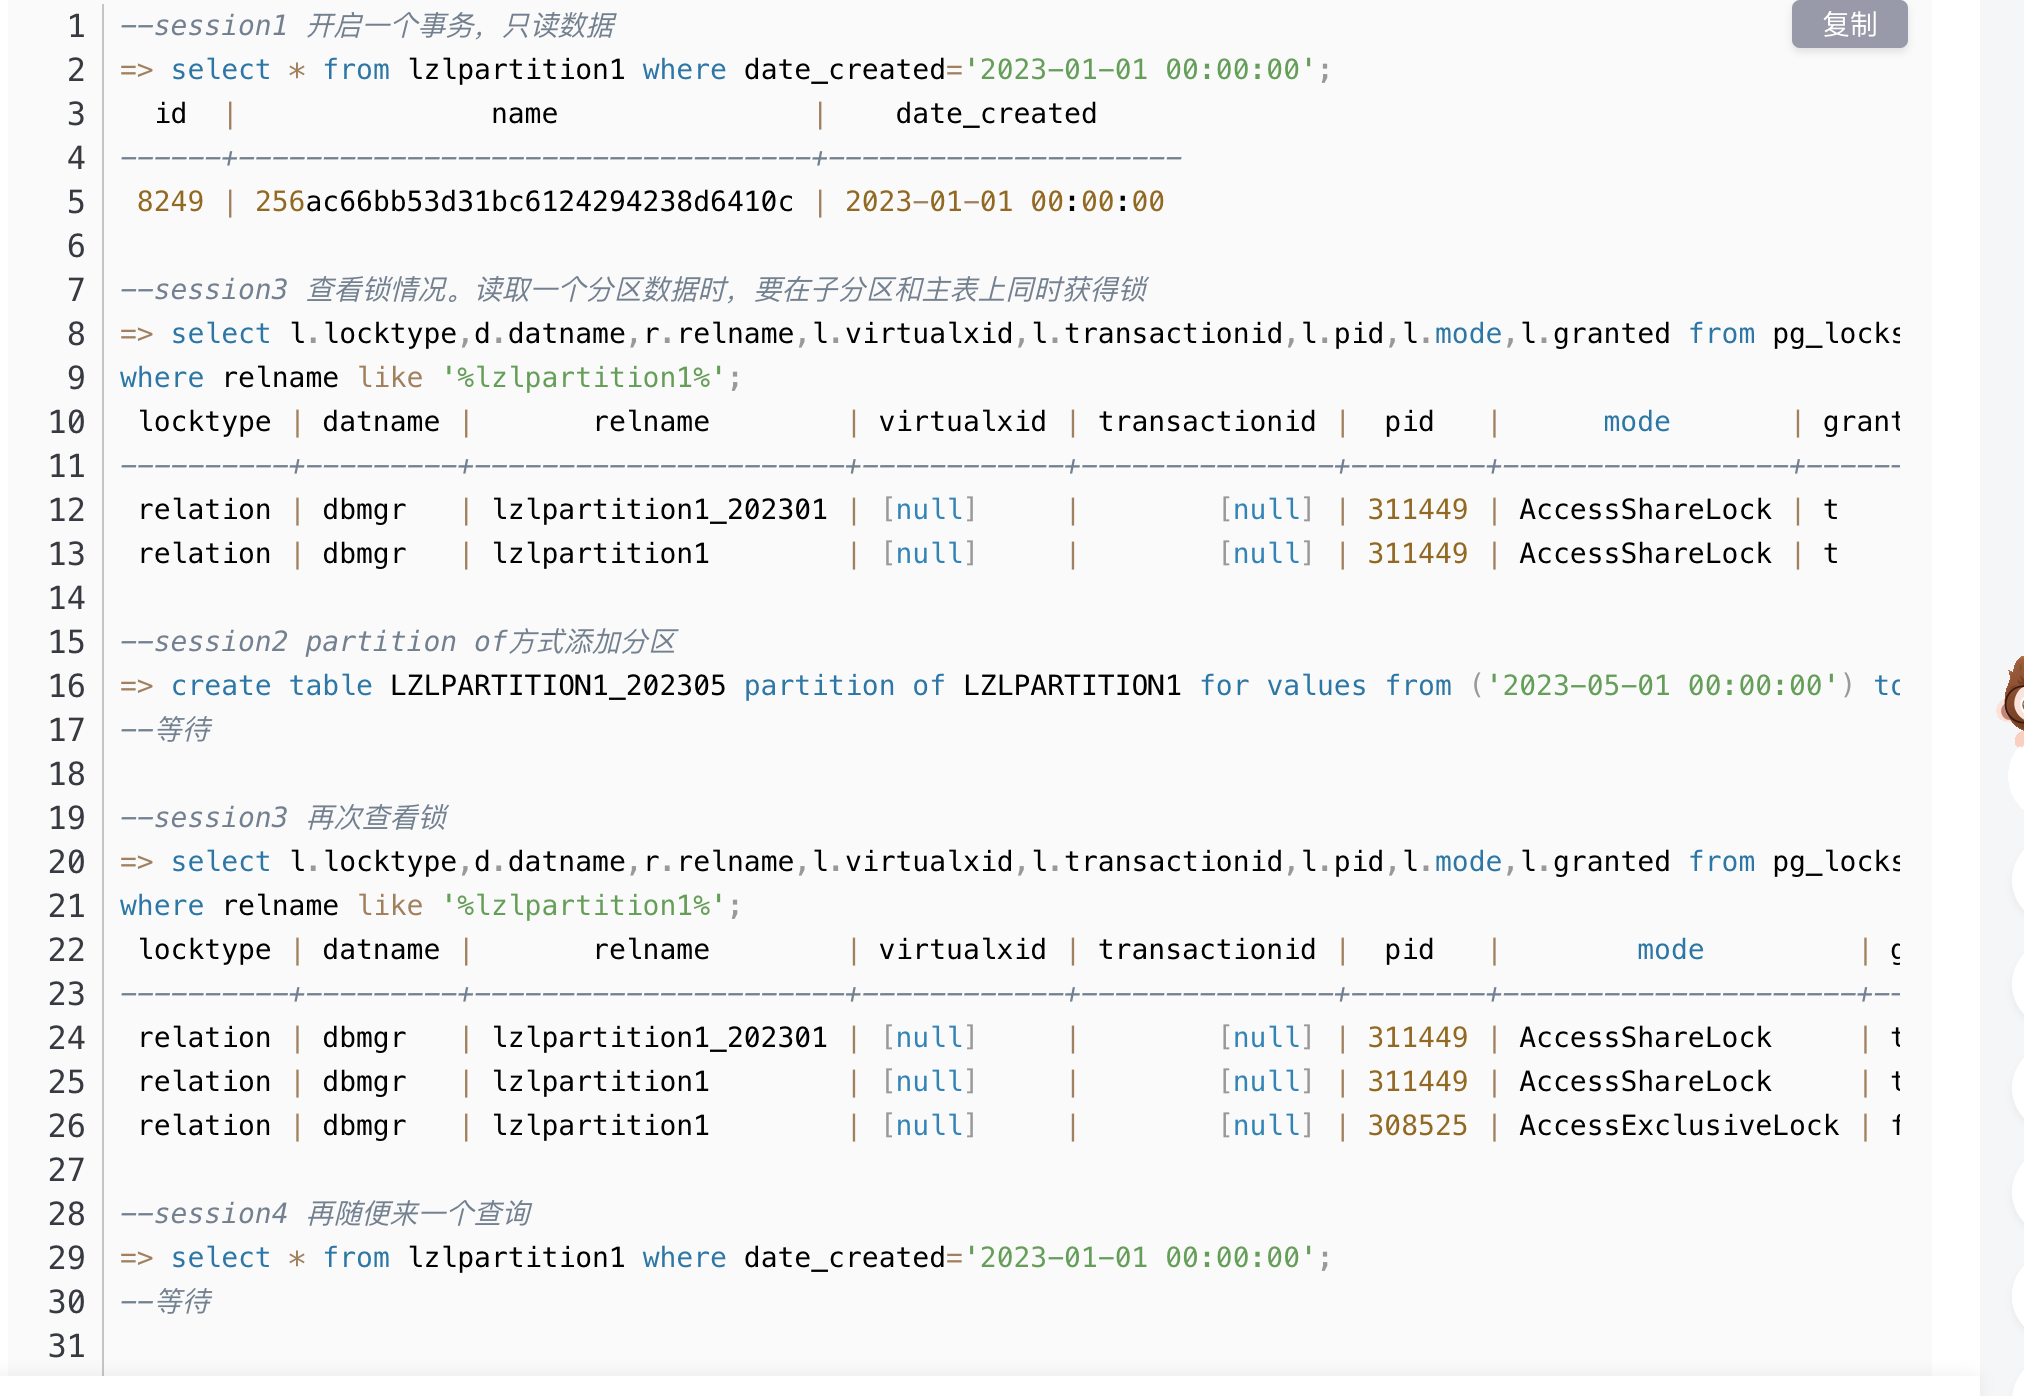
process 33569 still waiting for RowExclusiveLock on relation 53733 of database 17073 after 1000.048 ms","Process holding the lock: 125889. Wait queue: 33569.When PARTITION OF adds a partition, it acquires an AccessExclusiveLock (level 8) on the parent table, which blocks all operations on the partitioned table. Normally, adding a partition via PARTITION OF is very fast, and the lock is released immediately. However, if there’s a long-running transaction on the partitioned table, the level 8 lock on the parent table must wait, causing subsequent blocking.
(Stolen from my own diagram):
However, in this case there was no long transaction on the table, yet PARTITION OF took 35 minutes.
From historical process information, this process was in D state (uninterruptible sleep), which was suspicious. Initially, I suspected memory or disk issues, but after investigation, everything was normal.
However, this problem was easy to reproduce — running create table partition of directly in a simulation environment was very slow. pg_stat_activity showed the statement waiting on IO:
wait_event_type  | IO
wait_event       | DataFileRead
state            | active
query            | create table xxx partition of xx for values from ('2025-05-01 00:00:00') to ('2025-06-01 00:00:00');
strace tracing revealed the process was heavily reading one file:
pread64(53, "\22\2\0\0\220w\321>\0\0\5\0\24\0018\1\0 \4 \0\0\0\0\200\237\0\1\310\236p\1"..., 8192, 863485952) = 8192Using file descriptor 53, we identified the file:
[/proc/356174/fd] ll |grep 53
lrwx------ 1 postgres postgres 64 May 17 15:34 53 -> /lzl/pglzl/data/base/17076/25883
oid2name -d lzldb -f 25883
From database "lzldb":
Filenode Table Name
-----------------------------------------------
25883 table_partition_defaultFinally located: the table table_partition_default:
=> \d+ table_partition_default
...
Partition of: table_partition_default DEFAULT
Partition constraint: (NOT ((date_created IS NOT NULL) AND ((date_created < '2022-05-01 00:00:00'::timestamp without time zone) OR ((date_created >= '2022-05-01 00:00:00'::timestamp without time zone) AND (da


=> \dt+ table_partition_default
                                          List of relations
 Schema |                Name             | Type  | Owner | Persistence | Size  | Description
--------+------------------------------------+-------+------------+-------------+-------+-------------
 public | table_partition_default         | table | user1 | permanent   | 50 GB |
(1 row)
It was the default partition table, with tens of GB of data. Oracle DBAs might find this unfamiliar — PG’s default partition receives data that doesn’t fall into any defined partition range. The default partition ensures data is still accepted even if no matching range is defined.
If data exists in the default partition and a new partition needs to cover that range, what happens? It directly throws an error:
=> create table if not exists table_partition_pxxxx partition of table_partition for values from ('2023-01-12 00:00:00') to ('2023-01-13 00:00:00');
ERROR:  23514: updated partition constraint for default partition "table_partition_default" would be violated by some row
SCHEMA NAME:  public
TABLE NAME:  table_partition_default
LOCATION:  check_default_partition_contents, partbounds.c:3227
As you can see, when adding a child partition, the default partition’s partition constraint is automatically modified. The default partition constraint check is essentially validating the default partition’s data against the new partition’s range.
At this point, the cause is clear:
When adding a new child partition to a partitioned table, the partition creation statement needs to validate data in the default partition to ensure the new partition’s data range doesn’t conflict with existing default partition data. This caused CREATE TABLE PARTITION OF to read a massive amount of default partition data, preventing the new partition from being created. The blocking then cascaded, making business data unqueryable and unwritable.
Summary and Recommendations#
PostgreSQL partitioned tables are becoming increasingly common. Maintaining partitions requires attention to many details. I recommend reading PostgreSQL Partitioned Tables, which covers almost everything.
In this case, the key to resolution is the data in the default partition. Before refactoring the default partition, do not use PARTITION OF to create child partitions.
Default partition refactoring plan:
- Detach the default child partition, then properly create child partitions, and reinsert the default table data back into the partitioned table.
- If necessary, after detaching and creating proper child partitions, create an empty default partition to maintain business data continuity.
- Note that detach differs from attach — detach requires a level 8 lock on the parent table. PG14 supports
DETACH CONCURRENTLY.
If you don’t refactor the default partition, check the current data range in the default partition. Using ATTACH to add child partitions will be slow, but won’t block reads and writes.
Finally, a review of best practices for adding partitions:
PARTITION OF requires a level 8 lock on the parent table, which carries risk. The recommended approach is to use ATTACH to add new child partitions (partition indexes can be handled similarly). This does not block reads and writes, has no business impact, and can be done online.
The correct approach for adding new partitions:
CREATE TABLE lzlpartition1_202303
  (LIKE lzlpartition1 INCLUDING DEFAULTS INCLUDING CONSTRAINTS);
alter table LZLPARTITION1 attach partition LZLPARTITION1_202303 for values from ('2023-03-01 00:00:00') to ('2023-04-01 00:00:00');
If the new partition already has data, ATTACH may still be slow. You can optimize by pre-creating constraints:
The correct approach for adding a partition that already has data:
-- Reduce verbose DDL by using LIKE
CREATE TABLE lzlpartition1_202303
  (LIKE lzlpartition1 INCLUDING DEFAULTS INCLUDING CONSTRAINTS);
-- Skip this step if no data exists. Add a CHECK constraint referencing other partitions' Partition constraint to reduce ATTACH constraint validation time.
alter table lzlpartition1_202303 add constraint chk_202303 CHECK ((date_created IS NOT NULL) AND (date_created >= '2023-03-01 00:00:00'::timestamp without time zone) AND (date_created < '2023-04-01 00:00:00'::timestamp without time zone));
-- Add partition via ATTACH
alter table LZLPARTITION1 attach partition LZLPARTITION1_202303 for values from ('2023-03-01 00:00:00') to ('2023-04-01 00:00:00');
-- Optional. Before transactions occur on the new partition, drop the extra CHECK constraint
alter table lzlpartition1_202303 drop constraint  chk_202303;