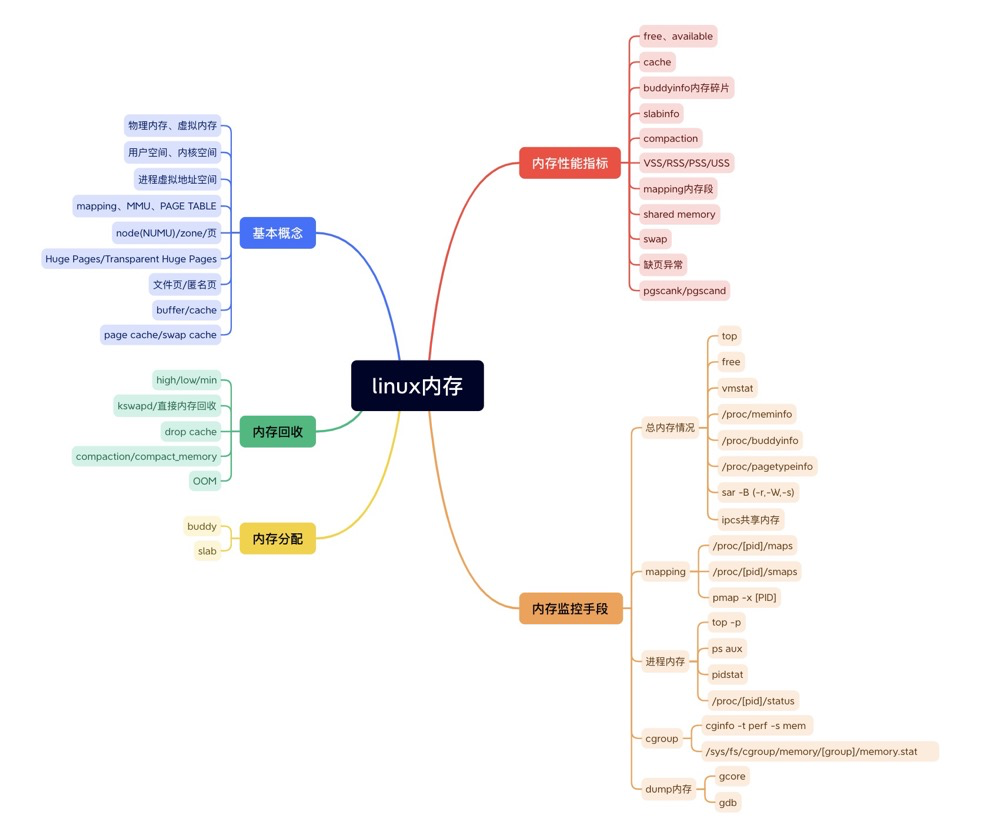
Basic Memory Concepts#
Operating system memory is very important and fairly complex. Many knowledge points need to be mastered to further analyze program issues. Since this is the first comprehensive and systematic exposure to OS memory, the goal is to understand Linux memory concepts thoroughly and at a low level without diving deep into principles, so this chapter will also try to avoid Linux source code knowledge.
Physical Memory and Virtual Memory#
 (https://en.wikipedia.org/wiki/Memory_address)
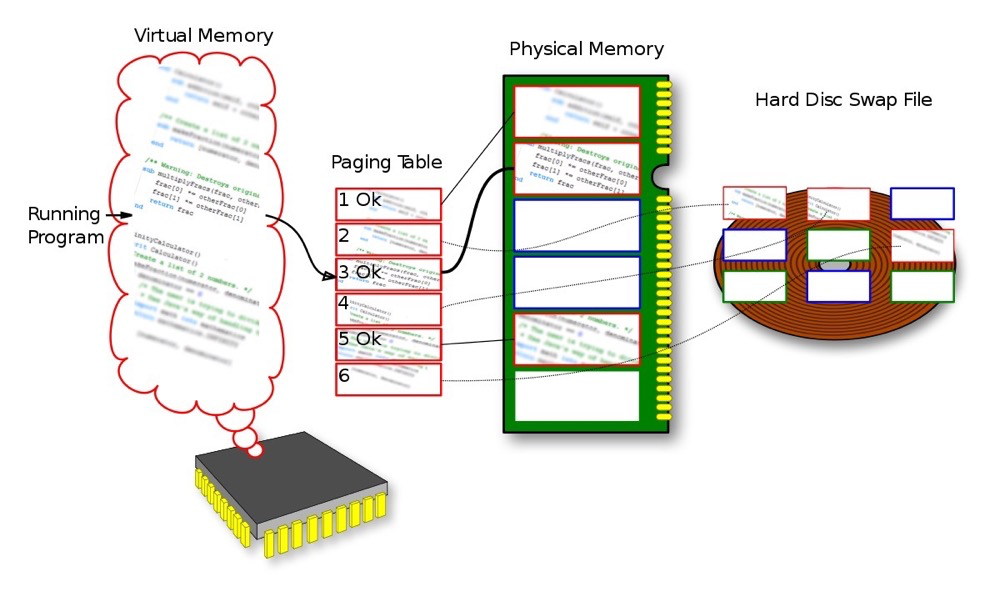
Physical Memory: Physical memory is the actual hardware memory present in a computer system, typically in the form of RAM (Random Access Memory).
Virtual Memory: Virtual memory is a linear region that has not been allocated actual physical memory. Programs think they have a larger address space than the actual physical memory. The implementation of virtual memory allows programs to access a larger address range than physical memory without requiring all data to be present in physical memory simultaneously. The kernel releases physical pages by releasing linear regions, finding the corresponding physical pages, and releasing them all.
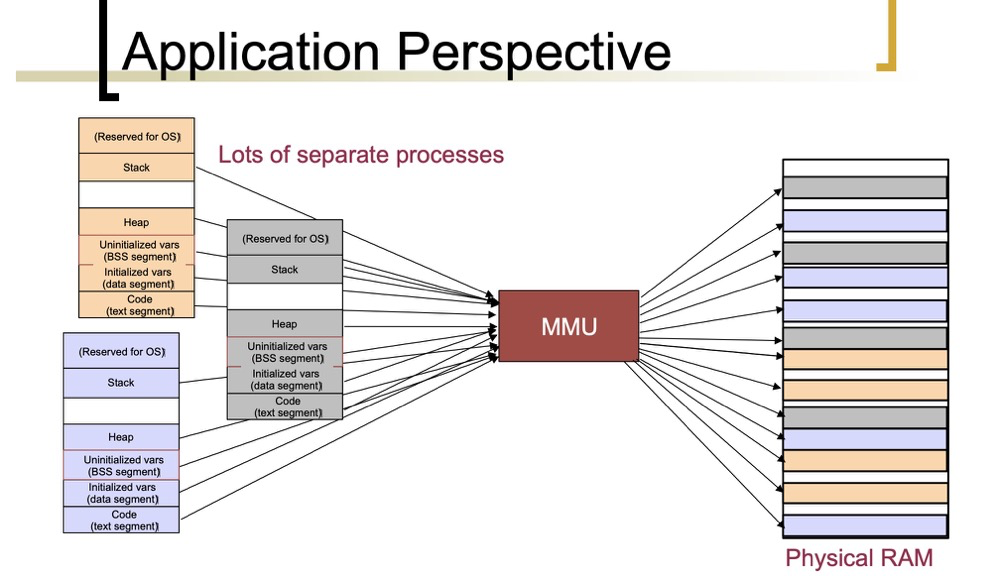
Memory Management Unit (MMU): A hardware component responsible for converting virtual addresses used by programs into physical addresses where data is actually stored in physical memory. The MMU’s primary task is to perform address mapping.
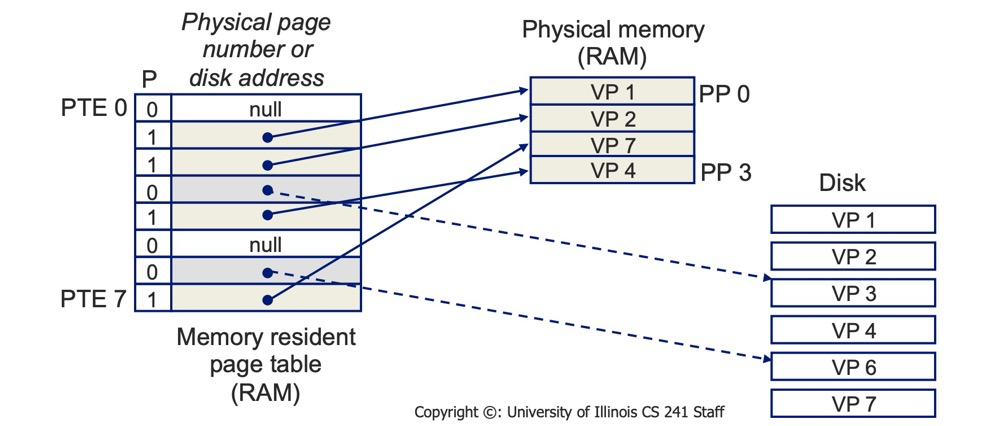
Page Table: A page table is a data structure used to store the mapping between virtual address space and physical address space. When a program attempts to access virtual memory, the MMU determines the corresponding physical address by querying the page table.
System call flow:
 https://users.cs.utah.edu/~aburtsev/cs5460/lectures/lecture19-memory-management/lecture19-memory-management.pdf
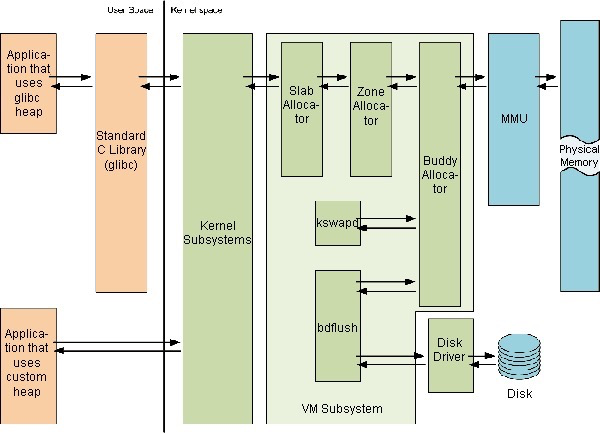
(The image is a bit blurry, the topmost text is “User Space|Kernel Space”)
- User programs can only access the kernel system through C libraries or system calls; user programs cannot directly access the kernel system
- The kernel system accesses physical memory through the MMU; it accesses disks and other external devices through drivers
- The virtual memory system (VM Subsystem in the figure above) includes buddy, slab algorithms, etc.
User Space and Kernel Space#
The process virtual address space is divided into user space and kernel space.
User Space:
- The space where user processes run in memory
- This portion of space is protected, and the system prevents other processes from accessing it (except for shared memory)
- However, kernel processes can directly access user processes
Kernel Space:
- Kernel space is the space used by kernel processes
- In kernel space, the operating system’s kernel code runs with higher privilege levels, allowing direct access to system hardware, process management, file system operations, etc.
Context Switching:
- When a user program needs to access system services or perform operations requiring higher privileges, a context switch from user space to kernel space is triggered.
- Context switching is an operating system mechanism for saving and restoring program state, ensuring no data loss occurs when switching between user programs and the kernel.
The division between user space and kernel space is to provide security isolation, preventing user programs from directly affecting critical parts of the operating system. Early operating systems and DOS did not distinguish between kernel and user space, so a single program’s error or malicious behavior could affect the entire system.
 (https://www.zhihu.com/tardis/zm/art/66794639?source_id=1003)
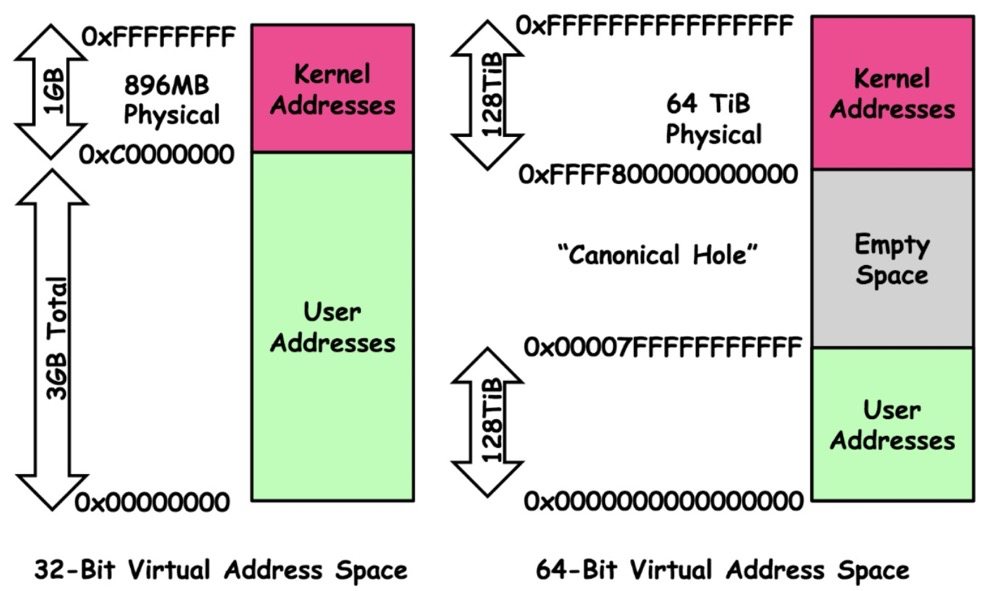
32-bit systems: Total 4GB address space, 3G UserSpace | 1G KernelSpace
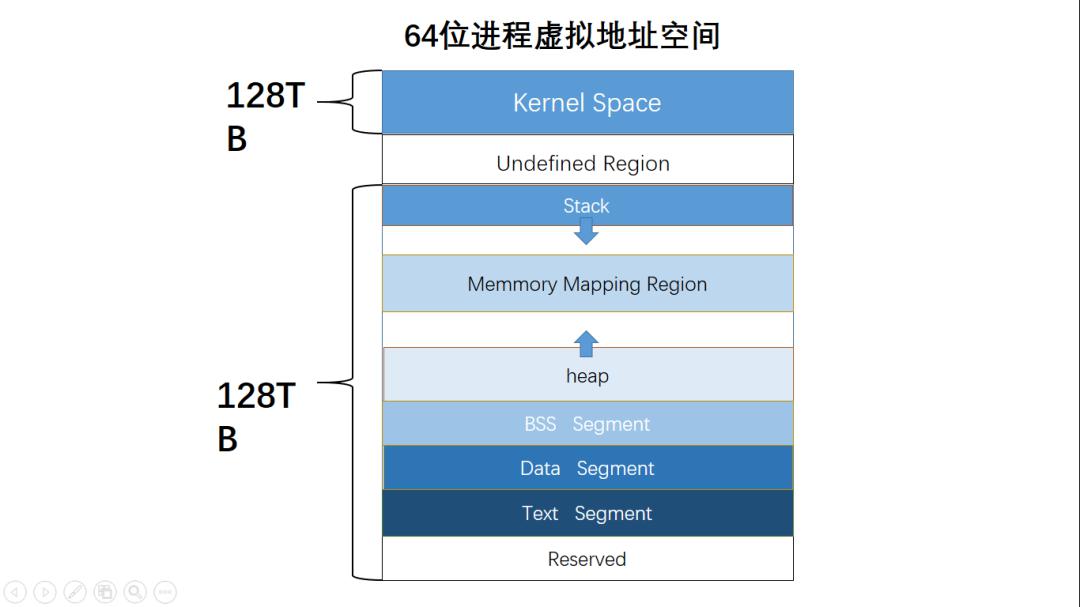
64-bit systems: Total 256TB address space, 128T UserSpace | 128T KernelSpace
2^32=4GB, 2^64=16777216TB, why does a 64-bit system only have 256TB address space?
The 64-bit computing wiki has an explanation. In short, 256TB (256 × 1024^4 bytes) of memory addresses is sufficient, and currently and in the imaginable future there won’t be 16EB (16 × 1024^6 bytes) of memory.
Process Virtual Address Space#
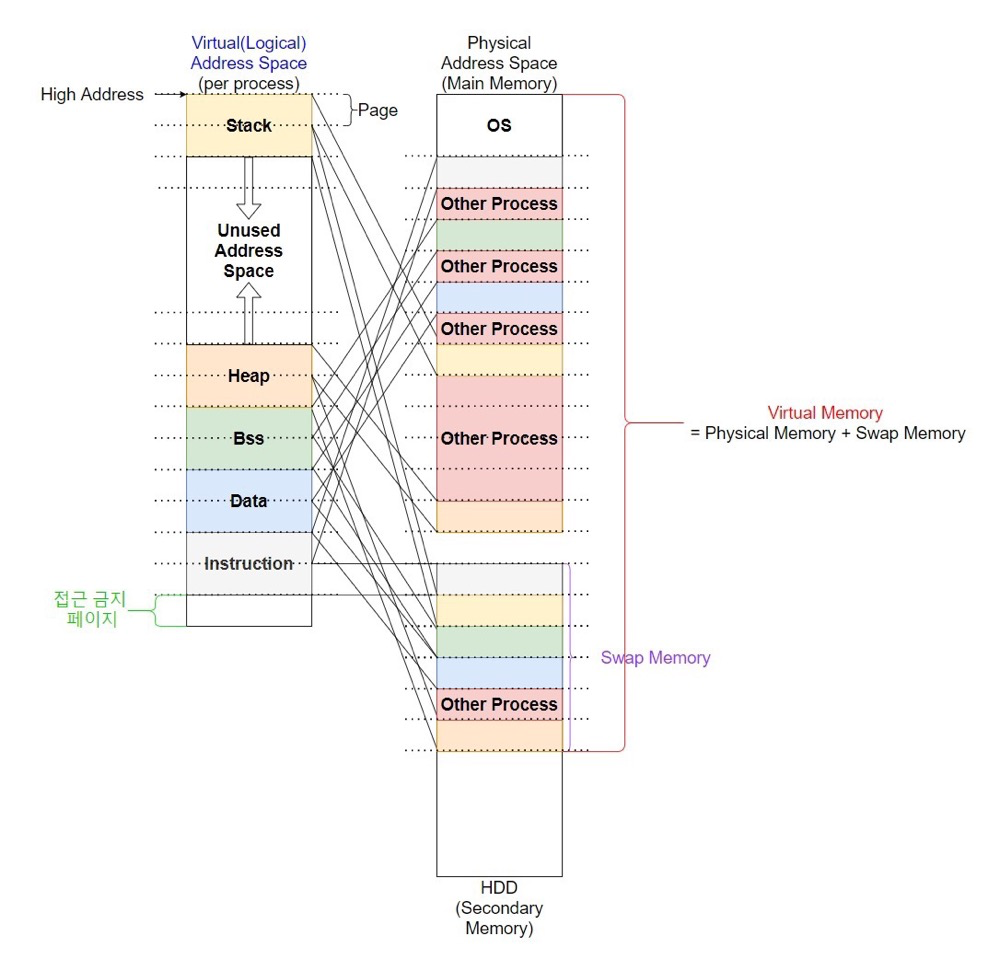
Each process typically has its own independent virtual memory space. Virtual memory is an abstract concept that provides each running process with an address space that appears continuous and private, making each process feel like it has the entire computer system’s full memory.
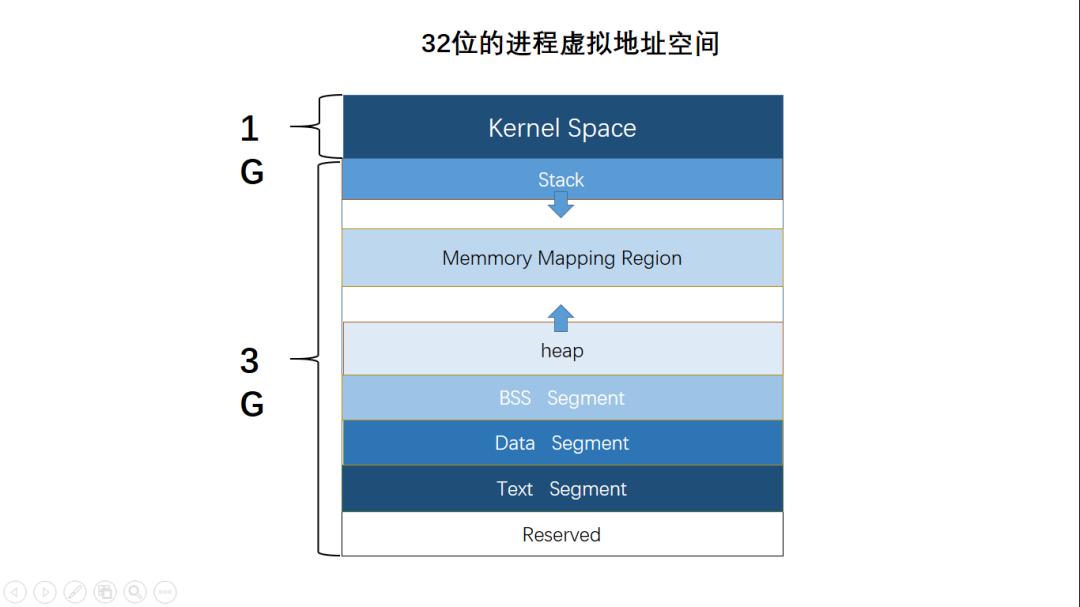
Process virtual address space layout:
(https://www.sohu.com/a/392831824_467784)
- The mmap mapping region expands from top to bottom, and the mmap mapping region and heap expand relative to each other until the remaining area in the virtual address space is exhausted. This structure facilitates the C runtime library’s use of the mmap mapping region and heap for memory allocation.
- Stack: Stores local variables and function parameters during program execution, growing from high addresses to low addresses
- Heap: Dynamic memory allocation area, managed through functions like malloc, new, free, and delete
- BSS (Uninitialized Variables): Stores uninitialized global variables and static variables
- Data: Stores global variables and static variables with predefined values in source code
- Text: Stores read-only program execution code, i.e., machine instructions
Process virtual address space distribution and mapping:
 (
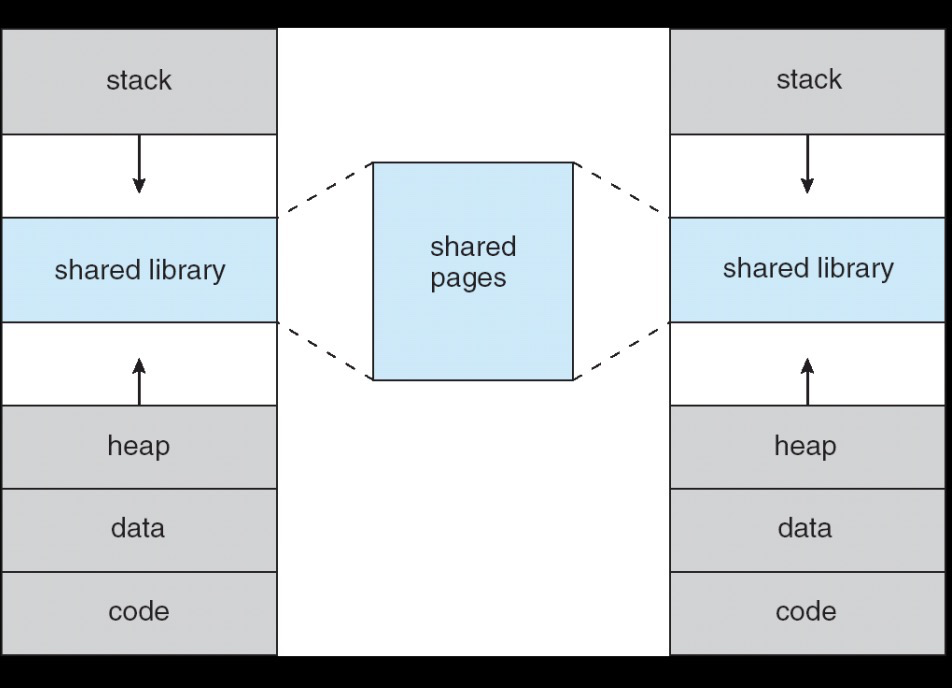
(Shared Memory#
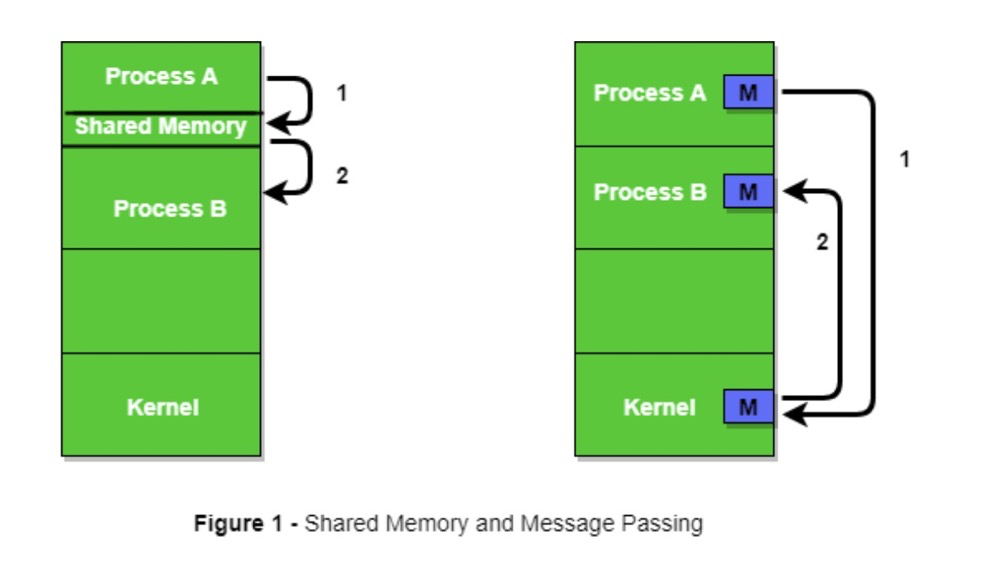
As mentioned earlier, the user space in the virtual address space cannot be accessed by other user processes. If multi-process user access to the same memory data is implemented through the kernel area, context switching cannot be avoided. Multi-process applications clearly need inter-process access, so a method that directly allows user processes to access the same physical memory emerged — this is shared memory.
Shared memory is one of the mechanisms for implementing IPC (Inter Process Communication), with other methods including message queues and semaphores.
 (https://www.geeksforgeeks.org/inter-process-communication-ipc/)
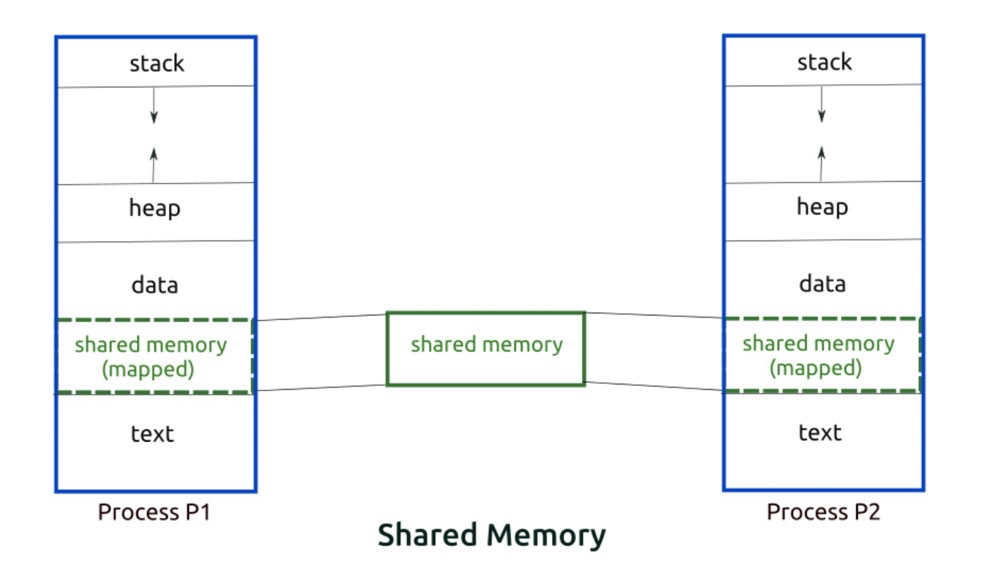
Since it is inherently multiple virtual memory address spaces corresponding to one physical memory address space, you just need to point a segment in the address spaces of two processes to the same physical memory.
 (
(Shared memory (seems like) has many implementation methods. For example, PostgreSQL defaults to using mmap to implement shared memory, refer to the shared_memory_type parameter and Managing Kernel Resources. Other shared memory implementations can be found in this article: Song Baohua: The Best Shared Memory in the World (The Most Thorough Linux Shared Memory Article)
Page Table#
The process virtual address space is per-process, while there is only one physical memory space. So how do you map and convert virtual memory and shared memory?
 (https://courses.engr.illinois.edu/cs241/sp2014/lecture/09-VirtualMemory_II_sol.pdf)
The page table is where the correspondence between virtual memory addresses and physical memory addresses is stored. (There are concepts like MMU and TLB here — let’s simplify and just think of it as the virtual-to-physical memory conversion function (PAGING), and only look at the page table here). A page table consists of a set of Page Table Entries (PTEs), with each PTE storing the map between a virtual page and a physical page.
Although a single page table can implement memory-to-virtual-memory conversion, implementing it directly this way would consume too much memory for the page table itself.
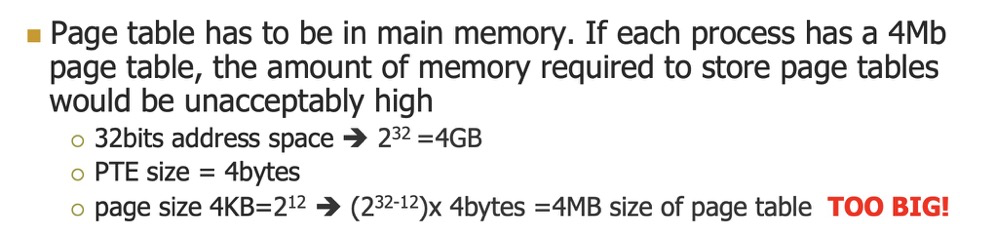 (https://courses.engr.illinois.edu/cs241/sp2014/lecture/09-VirtualMemory_II_sol.pdf)
Therefore, the single page table needs to be subdivided: two-level page tables and four-level page tables.
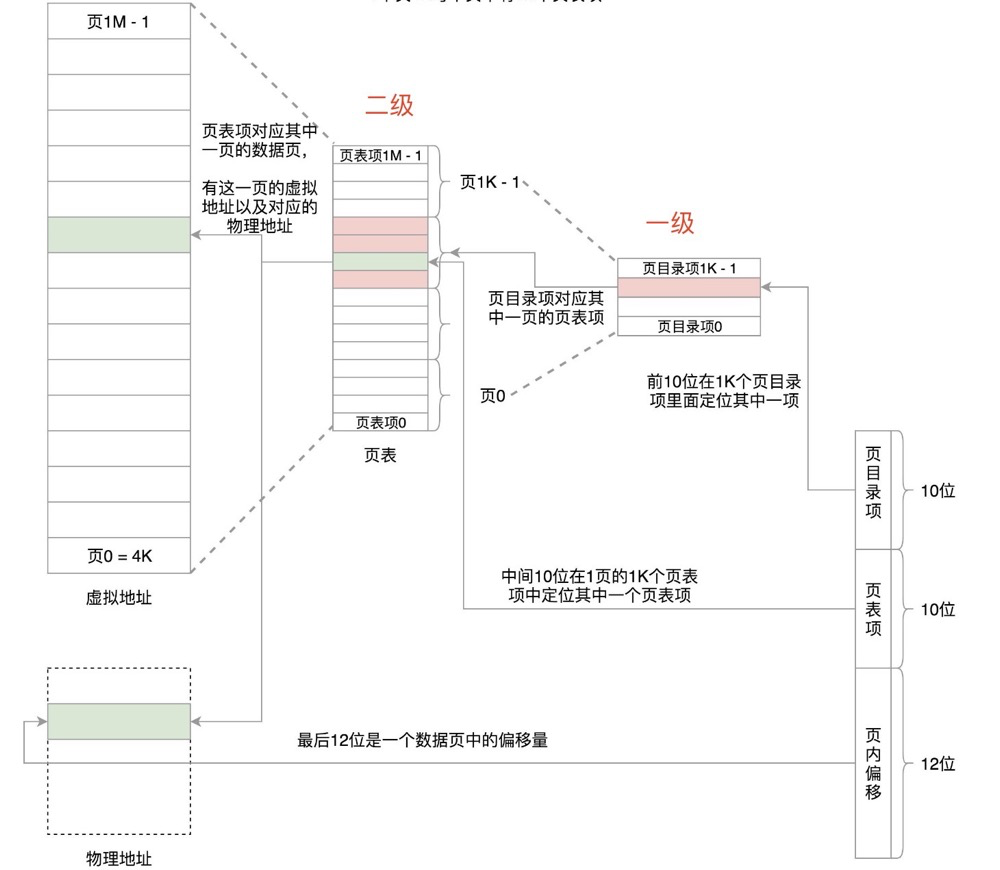
Two-level page tables:
A two-level page table is a further subdivision of a single page table. 4G of space requires 4M of page tables to store the mapping table. If these 4M are divided into 1K pages (4K each), these 1K pages also need a table for management, which we call the page directory table. This page directory table has 1K entries, each 4 bytes, making the page directory table size 4K as well.
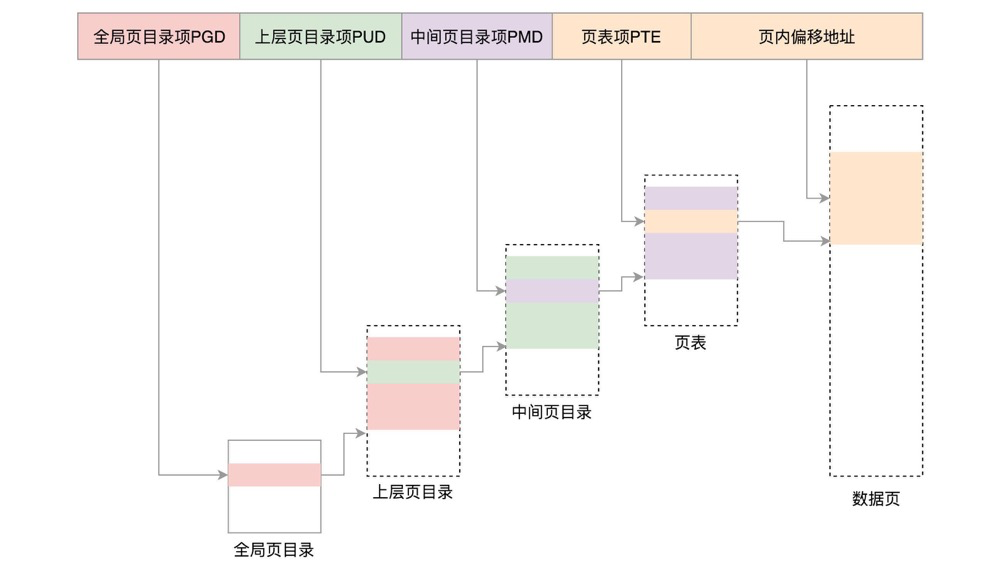
Four-level page tables:
For 64-bit systems, two-level page tables are insufficient; four-level page tables are needed.
 (https://maodanp.github.io/2019/06/02/linux-virtual-space/)
Check page table size:
[pg@lzl 2345]$ cat /proc/meminfo |grep PageTables
PageTables: 46736 kBNUMA#
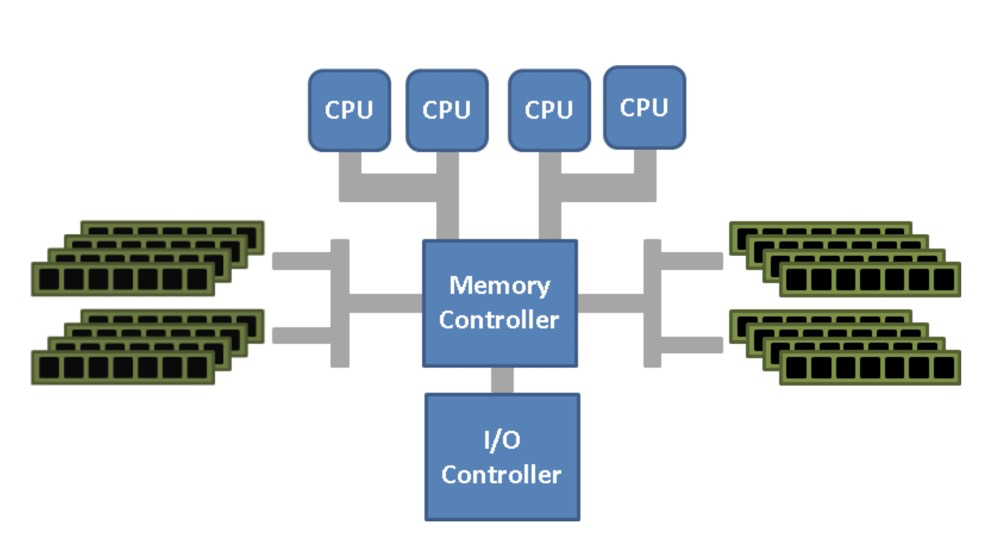
Uniform Memory Access (UMA): All CPUs have equivalent access time to memory. The problem with UMA is that multiple processors access memory through a single bus, increasing the load on the shared bus. Multiple processors contend for the memory controller causing conflicts. Additionally, the bus bandwidth is limited, leading to access delays.
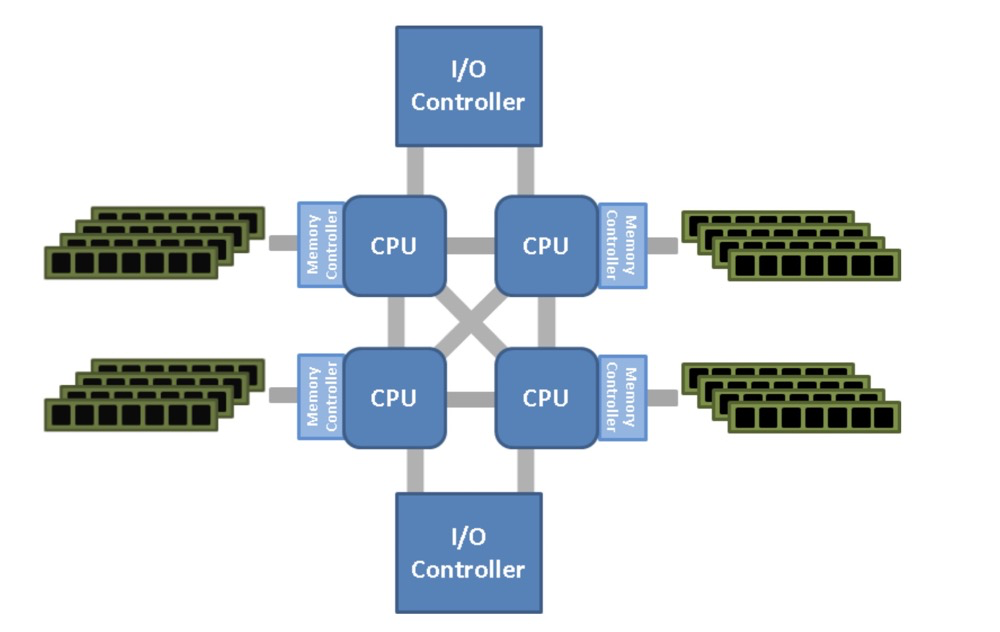
Non-Uniform Memory Access (NUMA): A small group of CPUs access their own local memory together. When there are multiple groups of CPUs and their memory groups, each group of CPUs and memory constitutes a NUMA node.
UMA:
NUMA:
 (
(Basic NUMA characteristics:
- CPU access to local node memory is faster than remote
- By default, Linux prioritizes allocating local memory on the CPU; the policy can be configured
- Each node has its own memory structure
- NUMA is not suitable for all scenarios; it requires adaptation by upper-layer applications
NUMA balancing: Achieves local access by automatically transferring tasks to remote CPUs or copying remote data to local memory. Enabled by default on Red Hat 7.
Transferring tasks or copying data itself consumes resources and can slow down tasks. This feature may not be suitable for some applications; for example, Oracle’s Exadata has targeted NUMA optimizations.
numactl: NUMA OS configuration tool.
numactl --show displays CPU and node information. Below is an example of 4 nodes with 64c 256g total, each node having 16c 64g:
available: 4 nodes (0-3)
node 0 cpus: 0 1 2 3 4 5 6 7 32 33 34 35 36 37 38 39
node 0 size: 65418 MB
node 0 free: 310 MB
node 1 cpus: 8 9 10 11 12 13 14 15 40 41 42 43 44 45 46 47
node 1 size: 65536 MB
node 1 free: 41 MB
node 2 cpus: 16 17 18 19 20 21 22 23 48 49 50 51 52 53 54 55
node 2 size: 65536 MB
node 2 free: 82 MB
node 3 cpus: 24 25 26 27 28 29 30 31 56 57 58 59 60 61 62 63
node 3 size: 65536 MB
node 3 free: 43 MBZone#
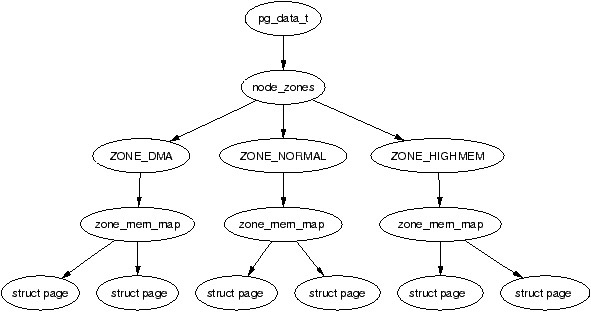
NUMA divides CPUs and memory into multiple nodes (node 0, node 1, node 2…). In UMA structures, the CPU memory as a whole can be viewed as node 0.
In Linux, each node is represented by the data structure struct pglist_data, with the data type typedef pg_data_t. Each node is further divided into multiple zones. A zone’s data structure is zone_t, with the data type zone_struct. There are generally 3 types: ZONE_DMA, ZONE_NORMAL, ZONE_HIGHMEM, each with different functions.
 (https://www.kernel.org/doc/gorman/html/understand/understand005.html)
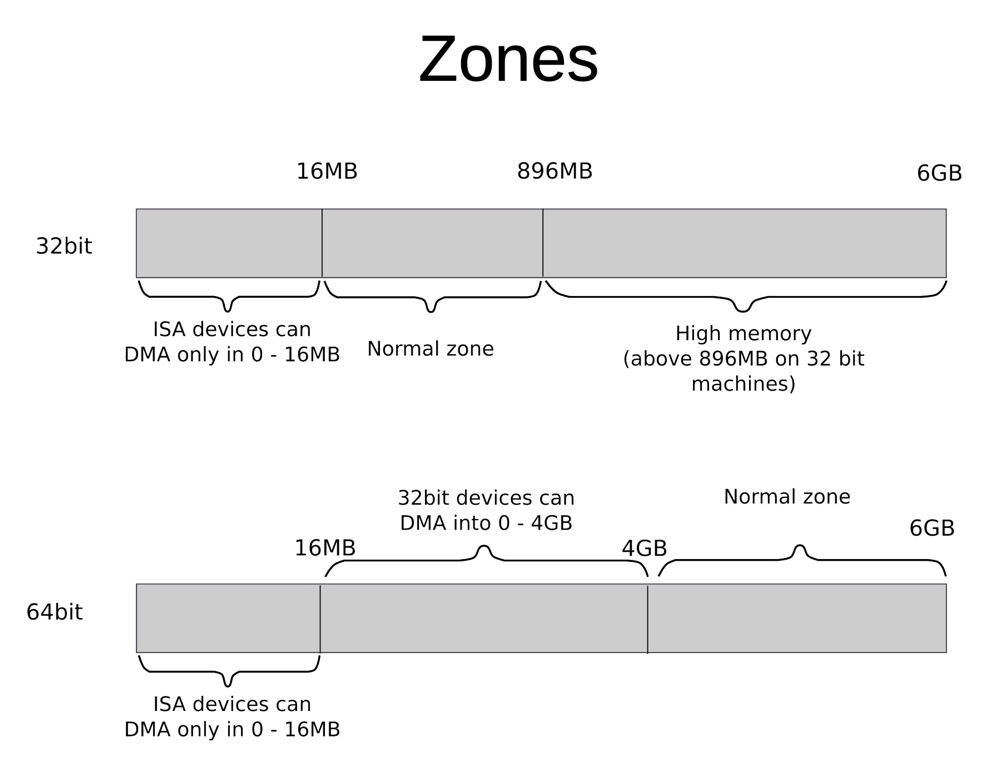
Zone distribution and functions in 32-bit:
ZONE_DMA: (<16MB), Direct Memory Access (DMA), the ancient 16 MiB limit, includes ISA devices.ZONE_DMA32: Since many devices encounter problems accessing memory that cannot be addressed with 32 bits, this zone was added in x86-64. This zone only exists in x86-64 architecture. (See ZONE_DMA32)ZONE_NORMAL: (16MB to 896MB), ordinary memory domain that can be directly mapped to the kernel segment; most kernel operations take place in the NORMAL zone, this is the most important zoneZONE_HIGHMEM: (>896MB), marks physical memory beyond the kernel segment, cannot be directly called by the kernel.
Zone distribution diagram for 32-bit and 64-bit:
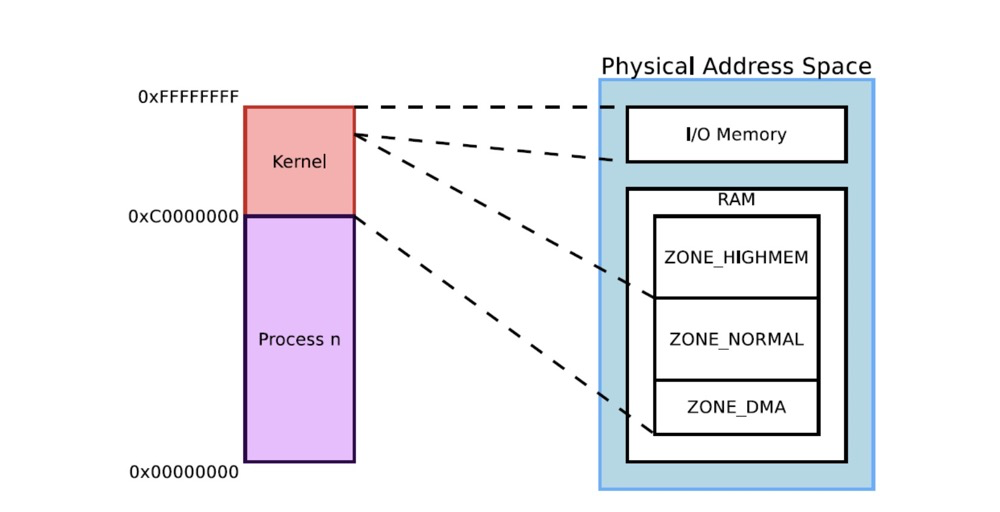
Note that zones are for physical memory. Virtual memory must switch from user mode to kernel mode before it can call physical memory. The following diagram shows the relationship between kernel addresses in virtual memory space and zones in physical address space:
 (
(Inspect zones:
cat /proc/zoneinfo
cat /proc/buddyinfo
cat /proc/pagetypeinfo
$ cat /proc/buddyinfo
Node 0, zone      DMA      1      1      1      1      1      0      1      1      1      1      2
Node 0, zone    DMA32    688   2080   1420    995    596    357    278    241    276     32    133
Node 0, zone   Normal 195748 204074 161167 119070  70791  33578   9556   2070   1034   2533   7328
Node 1, zone Normal 11705 51467 36752 21326 11343 7309 5024 3403 2597 3056 10898Pages#
Virtual memory and physical memory are divided into fixed-size segments, typically 4KB in size. So after virtual memory is divided, we have virtual pages, and after physical memory is divided, we have physical pages (PP or PF, Physical Page or Page Frame), also called page frames, also 4KB. The page frame represents the minimum unit of system memory.
Each page in the virtual address space can be mapped to a page frame in the physical address space through its descriptor.
Huge Pages / Transparent Huge Pages#
Pages are the minimum unit of memory allocation (default 4K). When mapping and allocating a large number of contiguous pages, performance is poor. Huge Pages solve this problem. Huge pages are not only cheaper to allocate, but the page table is also relatively smaller. hugepagesz is 2 MB or 1 GB, defaulting to 2MB. Huge Pages were implemented starting from Red Hat 6.
Since manually managing huge pages is cumbersome, Red Hat 6 also provided automatic huge page management, i.e., Transparent Huge Pages.
In Oracle database management, huge pages are generally enabled for SGA use, while transparent huge pages are disabled. There is plenty of related material available for searching.
Similarly, PostgreSQL can also enable huge pages. Since databases generally occupy more operating system memory, enabling huge pages for databases can generally reduce memory allocation pressure.
File Pages & Page Cache / Anonymous Pages & Swap Cache#
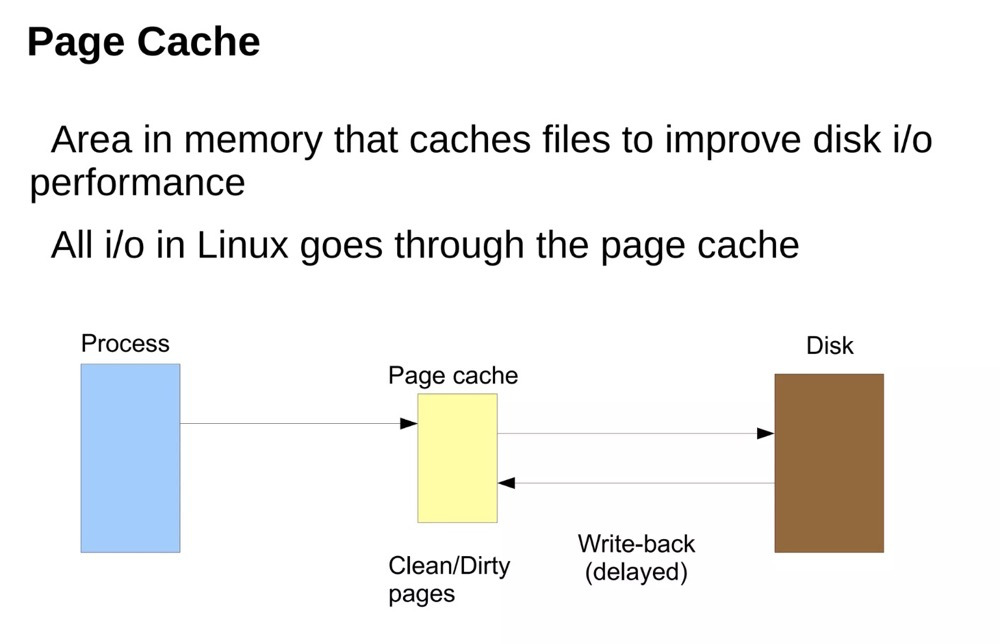
File pages can be mapped to files on disk. File system reads and writes use Page Cache as buffered IO. Dirty data is synced (or fsynced, etc.) to the corresponding disk periodically or when called. Page Cache is the memory area used to “boost” disk performance.
Correspondingly, pages without associated files are called Anonymous Pages, generally corresponding to heap and stack. When memory resources are tight, the kernel writes infrequently used anonymous page data to swap partitions or swap files.
In short:
- Page cache corresponds to file mappings
- Swap cache corresponds to anonymous pages
 (https://www.slideshare.net/raghusiddarth/memory-management-in-linux-11551521?from_search=2)
The above page cache diagram is from the operating system’s perspective. Application (such as database) writes can also be non-delayed, or even bypass Page Cache.
Memory Allocation#
Memory allocation is also very complex, involving many concepts. Two common memory allocation methods are buddy and slab.
Buddy#
The buddy system is used for allocating contiguous memory pages. Each zone has its own buddy system. The buddy system divides large blocks of memory to respond to memory allocation requests, and due to its coalescing characteristics, it can reduce system memory fragmentation.
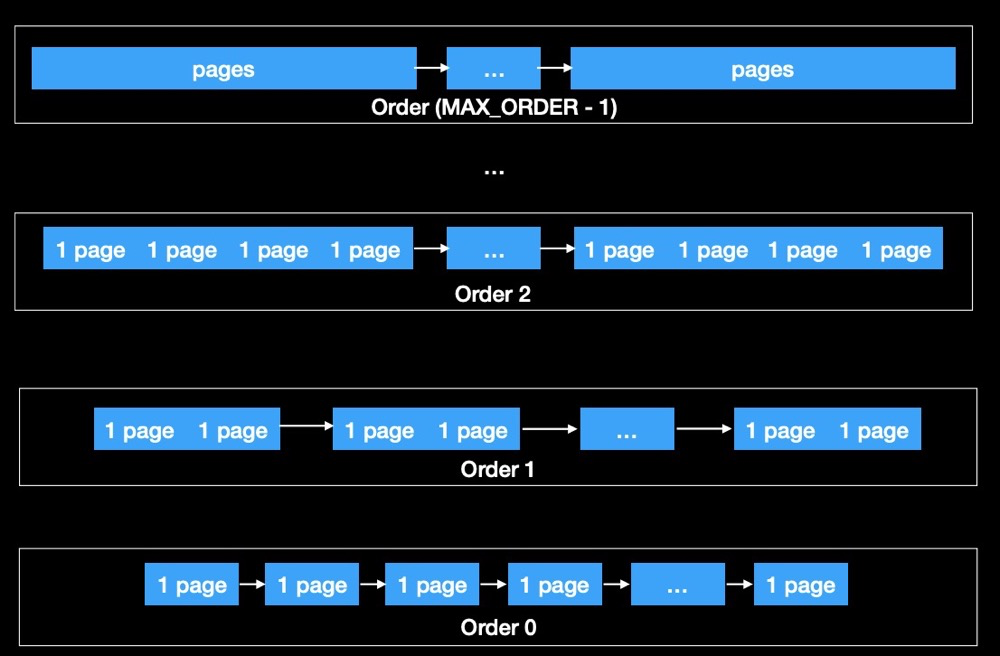
The buddy allocator divides memory into pages of powers of 2, with the maximum order being 10:
When a memory request is larger than the existing block size, the system splits the larger block into two equally sized buddy blocks. When memory is freed, the system attempts to merge adjacent buddy blocks into a larger block:
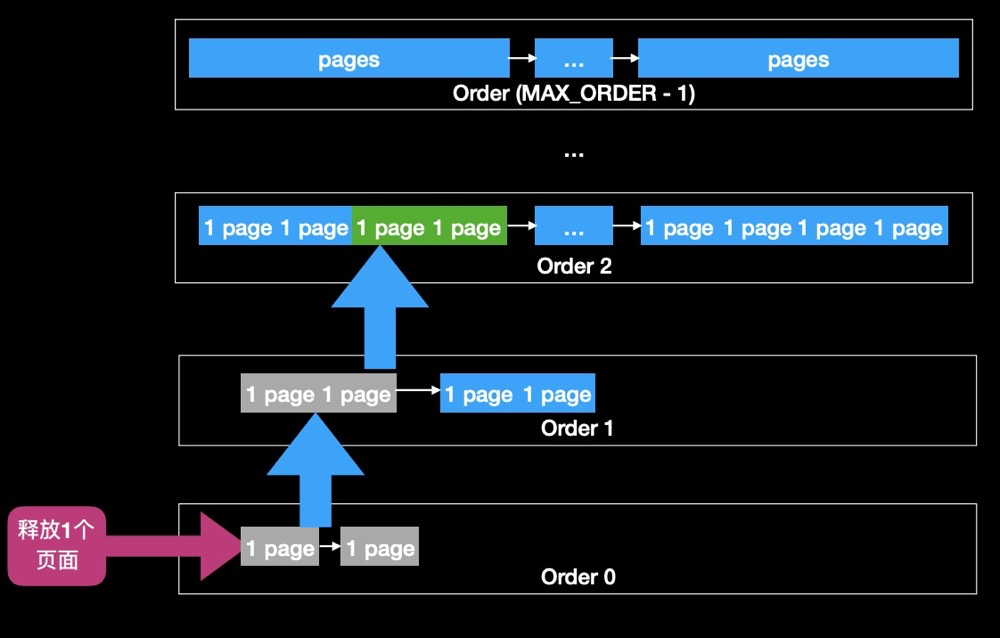
When freeing a page, the page is directly placed back into the free list. If the other half of the previously split page is also unallocated, they are combined into a double-sized page and given to the next larger list, and so on, until it can no longer be merged or has reached the top.
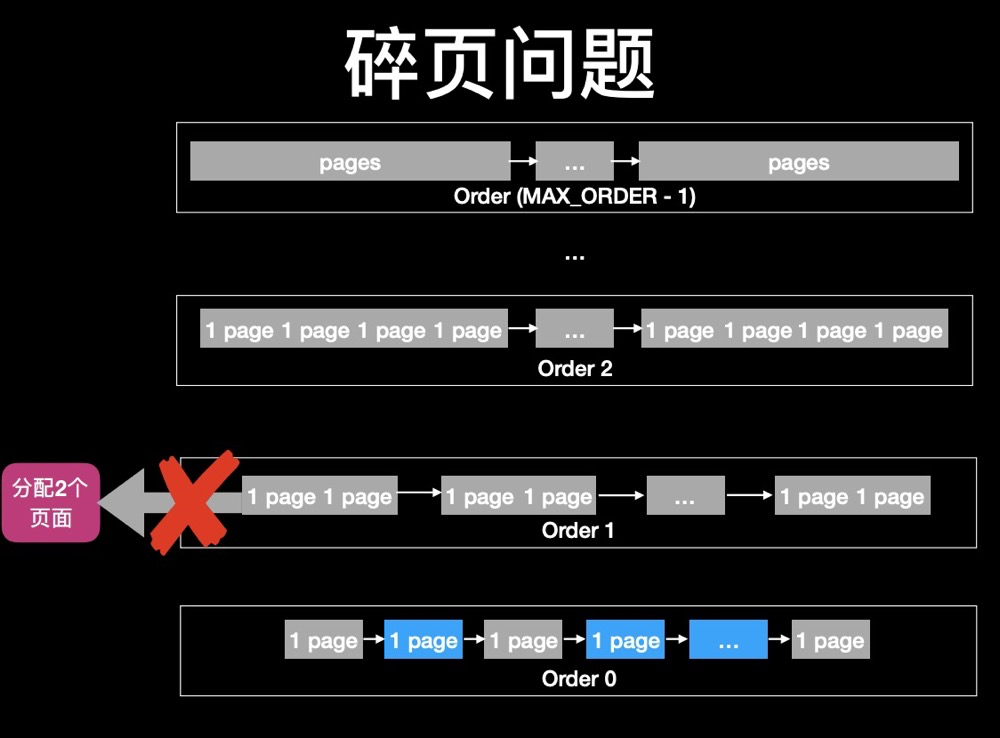
When higher-order pages are depleted due to continuous allocation, fragmentation issues arise when requesting higher-order pages:
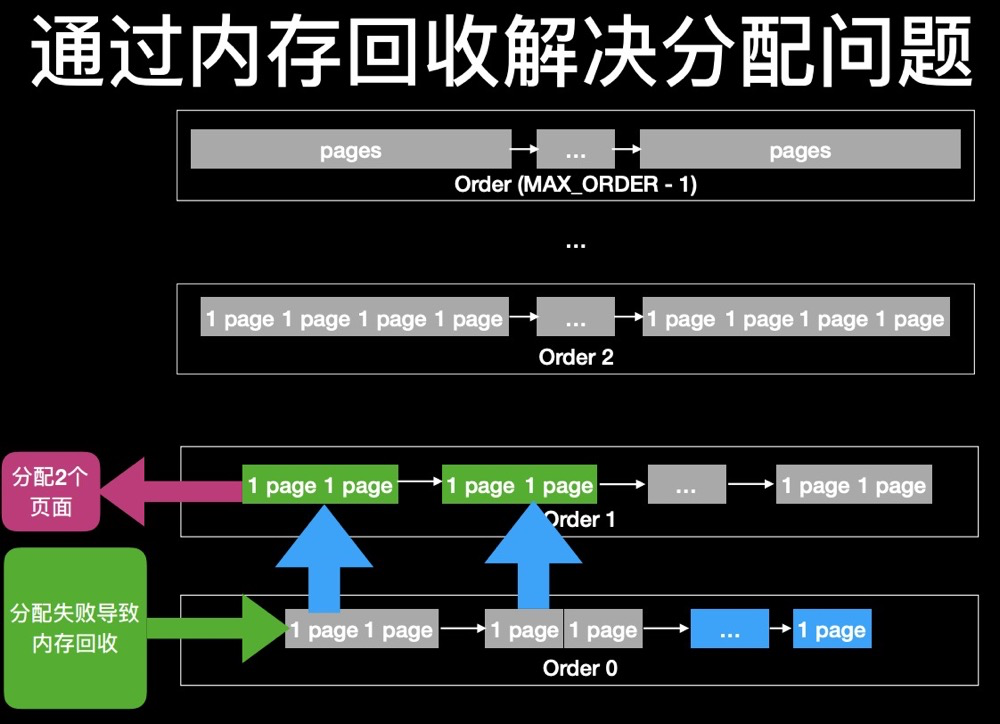
After waiting for memory reclamation to succeed, buddy itself merges lower orders into higher orders, then allocates higher-order pages:
 (The implementations of anti pages fragmentation in Linux kernel https://teawater.github.io/presentation/antif.pdf)
However, memory reclamation may also not keep up with allocation speed, so the buddy system is not always ideal.
Analysis example:
$ cat /proc/buddyinfo
Node 0, zone      DMA      0      0      0      1      2      1      1      0      1      1      3
Node 0, zone    DMA32      7      6      5      6      5      6      7      7      6      2    272
Node 0, zone Normal 317681 38869 31620 19250 8931 2579 815 182 19 5 0 - The above contains 3 ZONEs: DMA, DMA32, Normal
- Orders: 0 ~ 10, i.e., the count of each order in buddy. The maximum order of buddy is 10, i.e., 1024 pages, which is 4MB
- For example, the 3rd column in the Normal row indicates there are 31620 blocks of 2^2 contiguous memory available
- By extension, the further back, the more contiguous the space. The larger the number, the more contiguous space of that size there is. When large contiguous spaces are scarce, it indicates significant memory fragmentation
- Additionally, summing everything up gives the current free memory
Judging memory fragmentation issues through buddyinfo:
#host 1
Node 0, zone   Normal 317681  38869  31620  19250   8931   2579    815    182     19      5      0
#host 2
Node 0, zone   Normal   7321   7833  10885   8514   2311   1644   1663   1302   1141   7384  80675
The above shows the memory conditions of two hosts. Comparing them, the host below has more contiguous memory, while the host above has memory fragmentation issues.
Slab#
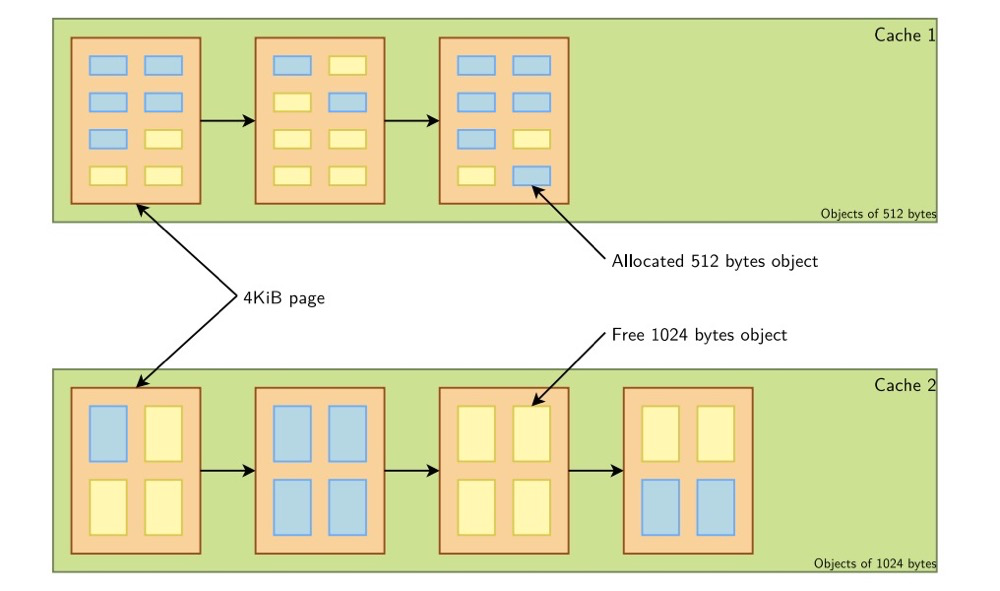
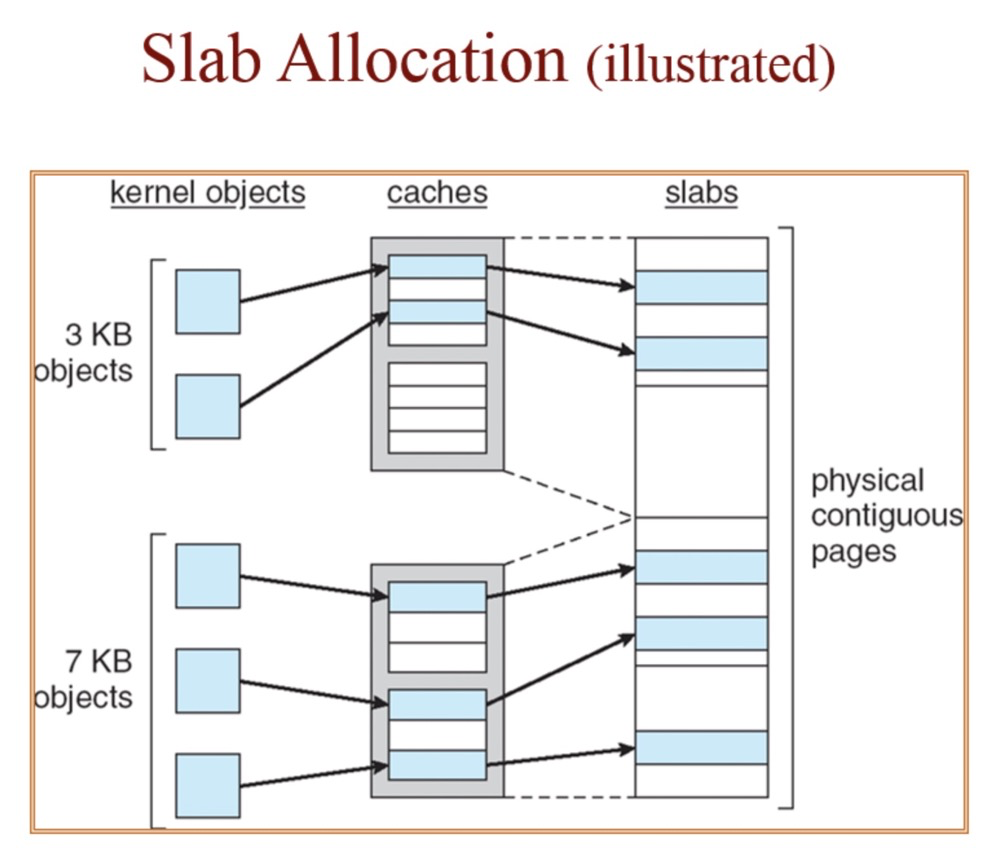
The slab allocator manages memory based on objects. The slab system is a memory allocation algorithm specifically designed for kernel memory. It works by dividing memory into fixed-size caches, where each slab contains a set of objects of the same type. When there is a memory request, the algorithm first checks if available objects exist in the appropriate slab cache. If they exist, the object is returned. If not, the algorithm allocates a new slab and adds it to the appropriate cache.
Objects of different sizes correspond to different slab caches:
 (https://bootlin.com/doc/training/linux-kernel/linux-kernel-slides.pdf)
Although slab has different caches and objects, slab still uses physically contiguous memory:
 (https://i.stack.imgur.com/wo8Gg.png)
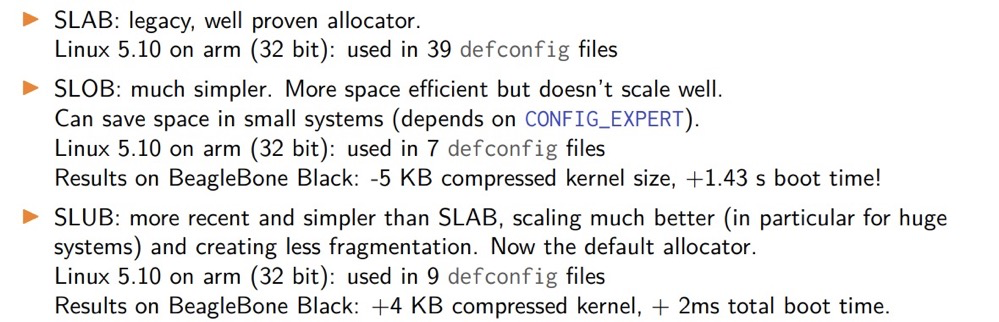
Slab also has 3 implementation methods:
Memory Reclamation#
Recommended article: Linux Forced Memory Reclamation, Linux Memory Source Code Analysis - Memory Reclamation
Memory Reclamation Overview#
- When system memory pressure is high, memory reclamation is performed on each zone under pressure. Memory reclamation mainly targets anonymous pages and file pages.
- For anonymous pages, during memory reclamation, some infrequently used anonymous pages are selected, written to the swap partition, and then released as free page frames to the buddy system.
- For file pages, during memory reclamation, some infrequently used file pages are also selected:
- If the content saved in this file page is consistent with the corresponding file content on disk, this file page is a clean file page and does not need to be written back; it is directly released as a free page frame to the buddy system.
- If the data saved in the file page is inconsistent with the corresponding data in the file on disk, this file page is considered a dirty page. It must first be written back to the corresponding data location on disk, and then released as a free page frame to the buddy system.
- After memory reclamation completes, the number of free page frames in the system increases, alleviating memory pressure. However, the reclamation process puts significant IO pressure on the system. Therefore, a threshold is set for each zone in the system. When the number of free page frames falls below this threshold, memory reclamation operations are performed. When the number of free page frames meets this threshold, the system does not perform memory reclamation operations.
Zone Watermarks and kswapd#
 (https://vivani.net/2022/06/14/linux-kernel-tuning-page-allocation-failure/)
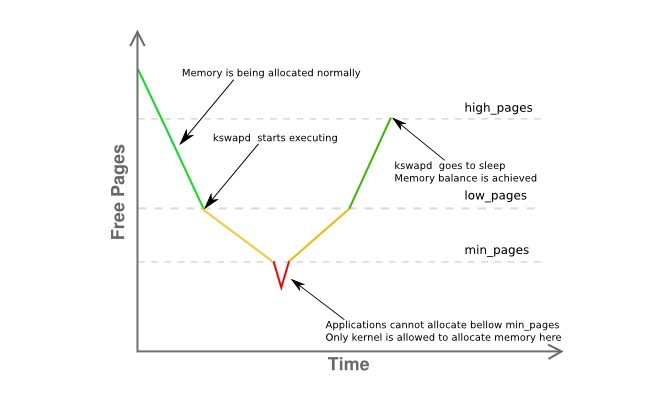
When available memory is low, the kswapd daemon is awakened to free pages.
- pages_low: When the number of available free pages falls below pages_low, the buddy allocator wakes up the kswapd process, and the kernel begins swapping pages out to disk.
- pages_min: When the number of available pages reaches pages_min, the pressure of page reclamation work is relatively high because the memory zone urgently needs free pages. The allocator will execute kswapd work in a synchronous manner, sometimes called direct reclaim.
- pages_high: Once kswapd is awakened and begins freeing pages, the kernel considers the zone “balanced” only when the number of available pages reaches pages_high. If the watermark reaches pages_high, kswapd will re-enter the sleep state. If free pages exceed pages_high, the kernel considers the zone state ideal.
Memory reclamation is performed on a per-zone basis. /proc/zoneinfo can display the values of min, low, and high.
vm.min_free_kbytes is the min_pages watermark, a very important OS parameter. Very low values prevent the system from effectively reclaiming memory, potentially leading to system crashes and service interruptions. Too high values increase system reclamation activity, causing allocation delays, which may lead the system to immediately enter an out-of-memory state.
Types of Memory Allocation and Reclamation#
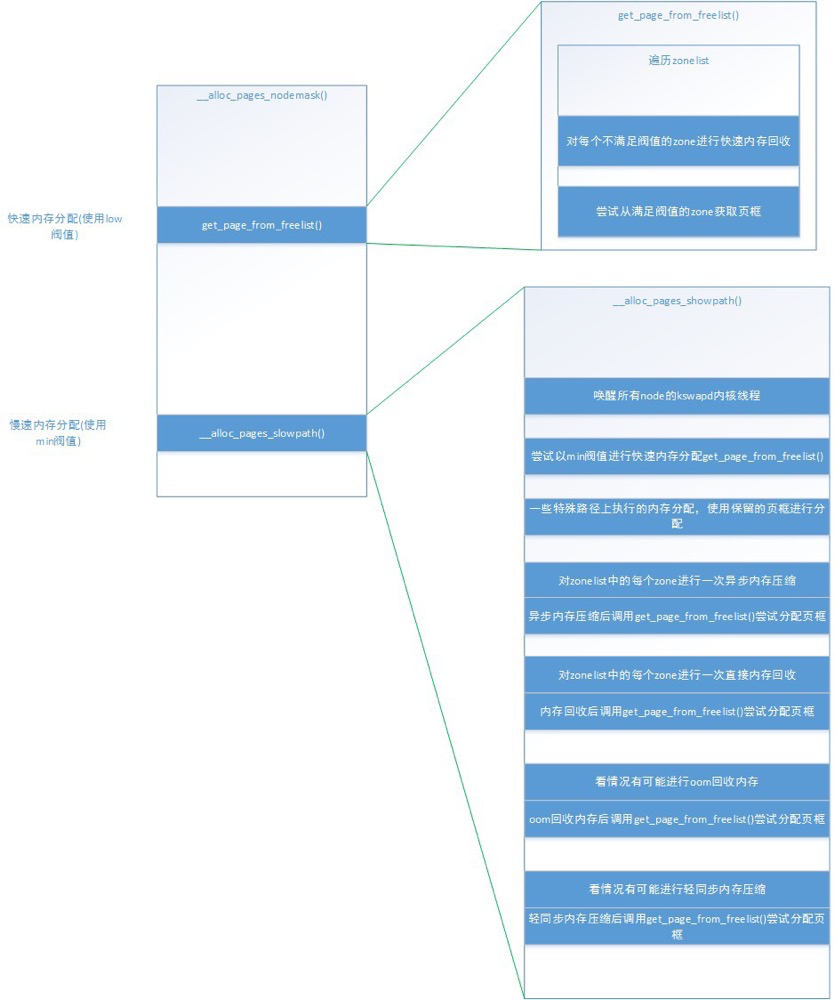
Fast Memory Allocation: Performed by the get_page_from_freelist() function, which obtains a suitable zone from the zonelist using the low threshold for allocation. If the zone has not reached the low threshold, fast memory reclamation is performed, and allocation is retried after fast memory reclamation.
Slow Memory Allocation: When fast allocation fails, meaning no zone in the zonelist obtained memory in fast allocation, the min threshold is used for slow allocation. During slow allocation, three main things happen: asynchronous memory compaction, direct memory reclamation, and light synchronous memory compaction. Finally, OOM allocation may occur depending on the situation. And after each of these operations, fast memory allocation is called once to attempt to obtain page frames.
 (https://blog.csdn.net/weixin_35094083/article/details/116688112)
Different memory allocation paths trigger different memory reclamation methods. Zone memory reclamation is divided into two types:
- Background Memory Reclamation (kswapd): When physical memory is tight, the kswapd kernel thread is awakened to reclaim memory. This memory reclamation process is asynchronous and does not block process execution.
- Direct Memory Reclamation (direct reclaim): If background asynchronous reclamation cannot keep up with process memory application speed, direct reclamation begins. This memory reclamation process is synchronous and blocks process execution.
Memory Compaction#
Memory compaction: see Memory Monitoring - /proc/pagetypeinfo section
LRU#
For zone memory reclamation, it targets three things for reclamation: slab, pages in LRU lists, and buffer_head. Here we only discuss memory reclamation targeting LRU lists.
The main purpose of LRU lists is to sort pages, placing pages most deserving of reclamation at the back and pages least deserving of reclamation at the front. Then, during memory reclamation, scanning proceeds from back to front, attempting to reclaim scanned pages.
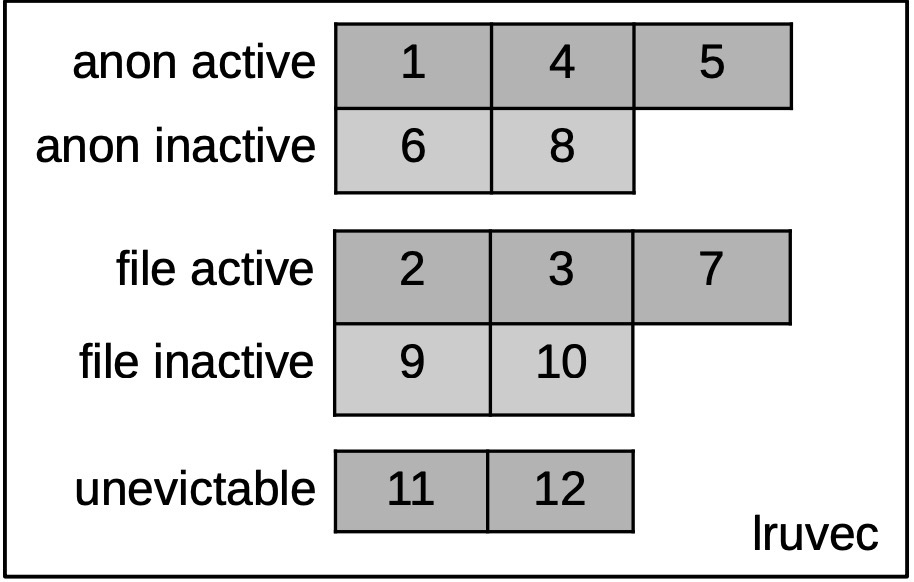
LRU list descriptor, containing 5 LRU lists: active/inactive anonymous page LRU lists, active/inactive file page LRU lists, and unevictable page list:
 (https://lpc.events/event/11/contributions/896/attachments/793/1493/slides-r2.pdf)
For memory reclamation, it only processes the first 4 LRU lists: active anonymous page LRU list, inactive anonymous page LRU list, active file page LRU list, and inactive file page LRU list. After reclaiming enough page frames, it returns directly: fast memory reclamation and kswapd memory reclamation do this.
Global lruvec can be viewed through meminfo (understood as LRU areas):
## cat /proc/meminfo |grep -i active
Active: 597380 kB
Inactive: 601920 kB
Active(anon): 10896 kB
Inactive(anon): 117376 kB
Active(file): 586484 kB
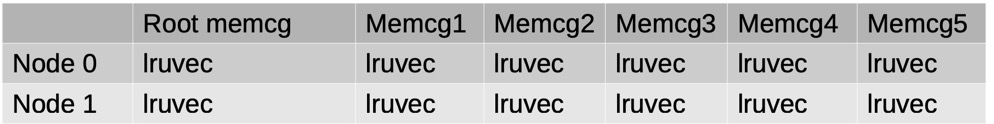
Inactive(file): 484544 kBIn reality, there is more than one lruvec. cgroup and NUMA nodes each have their own lruvec, and global also has its own lruvec.
Drop Cache#
Drop cache records which pages are caching file system data pages and writes data back to disk when pages are forcibly reclaimed, so they can be cached again on the next access.
Default value:
vm.drop_caches = 0. By default, the Linux kernel does not automatically clear caches.Setting
/proc/sys/vm/drop_cachesto 1: The kernel clears unused page cache.Setting
/proc/sys/vm/drop_cachesto 2: The kernel releases memory used by dentry and inode. Dentry and inode are file system metadata structures used to store file and directory information.Setting
/proc/sys/vm/drop_cachesto 3: Equivalent to 1+2, releases all unused caches.
When the kernel decides to reclaim certain caches, it checks whether the data in the cache is consistent with the data on disk. If the data is inconsistent, the kernel needs to write the data back to disk before reclaiming that cache. This process can cause IO spikes. When performing Drop Cache operations, it is recommended to avoid any important I/O operations as this may affect system performance.
Operation commands:
echo 3 > /proc/sys/vm/drop_caches  # Flush cache
echo 0 > /proc/sys/vm/drop_caches  # Restore default
Memory Monitoring#
Without understanding basic memory knowledge, it is actually very difficult to interpret memory monitoring information. With the above memory fundamentals in place, let’s go through memory-related monitoring commands and tools one by one.
What’s in the /proc Directory?#
/proc mainly contains process information and system information.
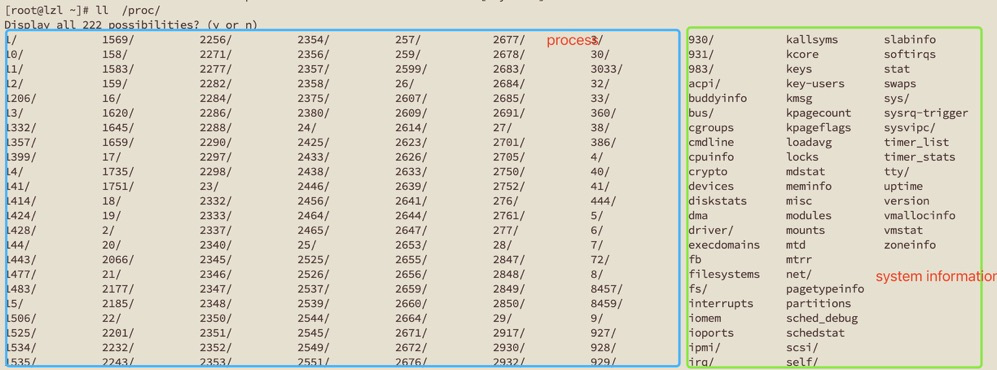
In the system information part, some are interfaces provided by Linux for system status, allowing you to view monitoring information at the entire operating system level, such as slabinfo, swaps, zoneinfo, buddyinfo.
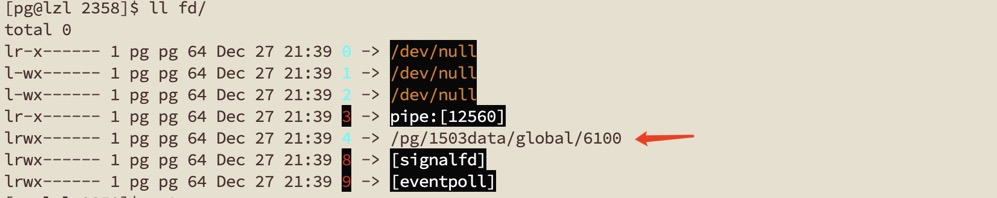
The other part, process, contains running data and status information for each process. cd into the corresponding process directory to see the FDs held by the corresponding process and process memory information.
Processes also have threads. Thread information directory: /proc/[pid]/task/[tid]/, with content similar to the process directory.
For more proc information, refer to proc(5) — Linux manual page
/proc/meminfo#
/proc/meminfo is the primary interface for understanding the current Linux system memory usage. The most commonly used commands like free, vmstat, ps obtain data through it. /proc/meminfo information is more comprehensive. Below we only list some common information. For detailed meanings, refer to the Red Hat documentation
# General memory information
cat /proc/meminfo | grep "Mem"
MemTotal:         994328 kB     # Total memory size (minus some reserved and kernel)
MemFree:           66428 kB     # Completely unused physical memory
MemAvailable:     207192 kB     # Maximum available memory for starting a new application without using swap space

# IO buffers
cat /proc/meminfo | grep -e "Buffers" -we "Cached"
Buffers:           12820 kB     # IO buffers used by raw disk blocks, not exceeding 20MB
Cached:           254592 kB     # Page cache size used by disks (includes tmpfs and shmem, excludes SwapCached)

# swap
cat /proc/meminfo | grep "Swap"
SwapCached:        13936 kB     # Swap cache contains anonymous memory pages determined to be swapped but not yet written to physical swap area
SwapTotal:        945416 kB     # Total swap space size
SwapFree:         851064 kB     # Remaining swap size

# lru active and inactive page counts (self-explanatory)
cat /proc/meminfo | grep -e "Active" -e "Inactive"
Active:           194308 kB
Inactive:         553172 kB
Active(anon):      59024 kB
Inactive(anon):   437264 kB
Active(file):     135284 kB
Inactive(file):   115908 kB

# Dirty pages
cat /proc/meminfo | grep -e "Dirty" -e "Writeback"
Dirty:                 0 kB     # Dirty pages not yet written
Writeback:             0 kB     # Dirty pages being written
WritebackTmp:          0 kB     # Temporary buffer for writebacks used by the FUSE module

# Map information
cat /proc/meminfo | grep -e "AnonPages" -e "Map"
AnonPages:         95296 kB     # Mapped anonymous pages
Mapped:           153192 kB     # Mapped file pages
DirectMap4k:      113336 kB     # Mapped 4k kernel pages
DirectMap2M:     1900544 kB     # Mapped 2M kernel pages
DirectMap1G:           0 kB     # Mapped 1G kernel pages

# Shared memory
cat /proc/meminfo | grep "Shmem"
Shmem:             28920 kB     # Total memory size of shmem and tmpfs
ShmemHugePages:        0 kB     # Total huge page memory size of shmem and tmpfs
ShmemPmdMapped:        0 kB     # Shared memory mapped into userspace with huge pages

# Kernel memory (note: slab is kernel)
cat /proc/meminfo | grep -ie "reclaim" -e "slab" -e "kernel"
KReclaimable:      35008 kB     # Reclaimable memory allocated to kernel
Slab:              88752 kB     # Slab cache
SReclaimable:      35008 kB     # Reclaimable memory in slab cache
SUnreclaim:        53744 kB     # Non-reclaimable memory in slab cache
KernelStack:        5988 kB     # Kernel stack memory used by all tasks

# Allocatable memory (different meaning from MemAvailable)
## CommitLimit=[("total RAM pages" - "total huge TLB pages") * overcommit_ratio]/100 + "total swap pages"
## In short, MemAvailable watermark plus swap equals allocatable memory
cat /proc/meminfo | grep -ie "commit"
CommitLimit:     1442580 kB     # Allocatable memory
Committed_AS:    3035924 kB     # Estimated memory needed in current worst-case scenario

# Virtual memory
cat /proc/meminfo | grep -e "Vmalloc"
VmallocTotal:   34359738367 kB  # Total allocated virtual memory size
VmallocUsed:       34780 kB     # Total used virtual memory size
VmallocChunk:          0 kB     # Largest contiguous virtual memory block

# Page table memory (self-explanatory)
cat /proc/meminfo | grep PageTables
PageTables:         4120 kB

# Huge page memory
cat /proc/meminfo | grep -i hugepage
AnonHugePages:     32768 kB
ShmemHugePages:        0 kB
FileHugePages:         0 kB
HugePages_Total:       0
HugePages_Free:        0
HugePages_Rsvd:        0
HugePages_Surp:        0
Hugepagesize: 2048 kB/proc/buddyinfo#
Due to its concise and easy-to-understand information, buddyinfo is the most commonly used method for judging memory fragmentation issues. See “Memory Allocation - Buddy section” for details.
$ cat /proc/buddyinfo
Node 0, zone      DMA      0      0      0      1      2      1      1      0      1      1      3
Node 0, zone    DMA32      7      6      5      6      5      6      7      7      6      2    272
Node 0, zone Normal 317681 38869 31620 19250 8931 2579 815 182 19 5 0 /proc/pagetypeinfo#
pagetypeinfo first provides information about page block sizes. It provides the same type of information as buddyinfo but broken down by type and detailing the number of pages of each type.
Before understanding pagetypeinfo, you need to first understand memory compaction.
Suppose the memory in a zone looks like this:

White represents free memory, red represents used memory. The memory fragmentation above is already quite severe. If a request for memory of order 2 or higher is made at this point, it cannot be allocated. This is where memory compaction comes into play. The compaction algorithm marks movable pages and free pages lists on the existing zone.
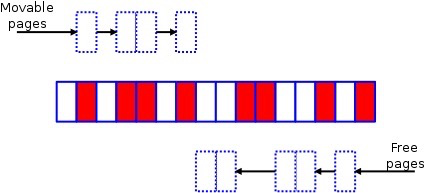
The movable scanner scans from bottom to top, and the free scanner scans from top to bottom. The movable and free scanners will eventually meet at some point in the middle. Then, through page migration, used pages are moved to the top of the zone.

Two trigger methods for page compaction:
- When allocating pages, if allocation fails at the LOW watermark, slow memory allocation is attempted, during which page compaction occurs
- Page compaction can be started with
echo x > /proc/sys/vm/compact_memory. After starting, the kernel threadkcompactdbegins page defragmentation.
Because page data is migrated to new locations, there are no performance issues as severe as those caused by memory reclamation. Moreover, since the goal is clearer, the cost of obtaining contiguous pages is lower. Additionally, ANON page reclamation requires SWAP, while this does not.
Now let’s look at /proc/pagetypeinfo:
$ cat /proc/pagetypeinfo
Page block order: 9
Pages per block: 512
... (DMA omitted)
Node 0, zone Normal, type Unmovable 870 530 391 157 103 41 9 2 1 0 0
Node 0, zone Normal, type Movable 5886 9235 5728 4072 1561 324 115 41 12 4 13018
Node 0, zone Normal, type Reclaimable 3 4 8 11 2 3 1 1 1 0 0
Node 0, zone Normal, type HighAtomic 0 0 0 0 0 0 0 0 0 0 0
Node 0, zone Normal, type CMA 0 0 0 0 0 0 0 0 0 0 0
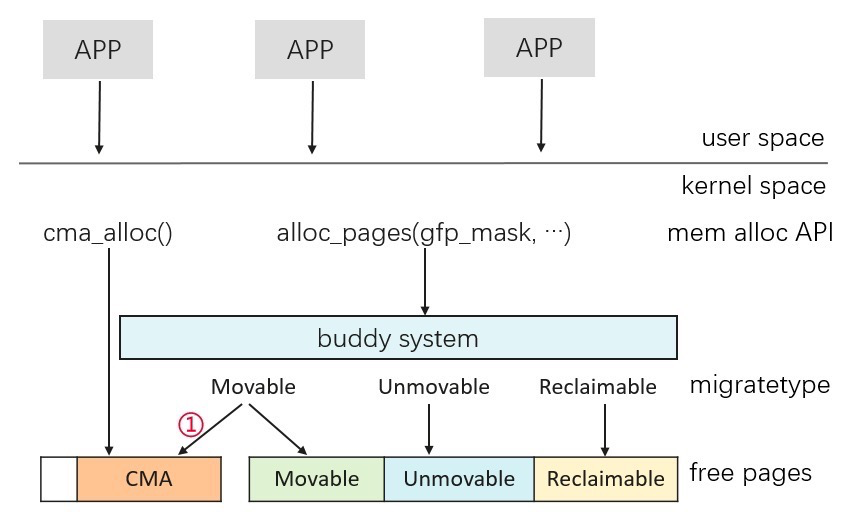
Node 0, zone Normal, type Isolate 0 0 0 0 0 0 0 0 0 0 0 Different pages are classified as pageblocks. Each pageblock is divided into several lists based on its type. When allocating memory, pages are requested from the corresponding list based on the requested page type, and when freed, they return to the corresponding list based on their pageblock. Different pageblocks:
- Unmovable: Pages that cannot be compacted
- Movable: Pages that can be compacted
- Reclaimable: Pages that can be reclaimed
- HighAtomic: Pageblock added to mitigate fragmentation issues. Only higher-order and same-level requests can request pages from this pageblock
- CMA: CMA stands for Contiguous Memory Allocator
- Isolate: Pages will not be allocated; used to help isolate pages. When isolating pages, pageblocks are first set to isolate to prevent them from being freed
CMA appears to be another large topic, which can be simply understood as a supplement to the buddy system:
 (Memory Journey — How to Improve CMA Utilization? https://ost.51cto.com/posts/10815)
smaps & maps & pmap#
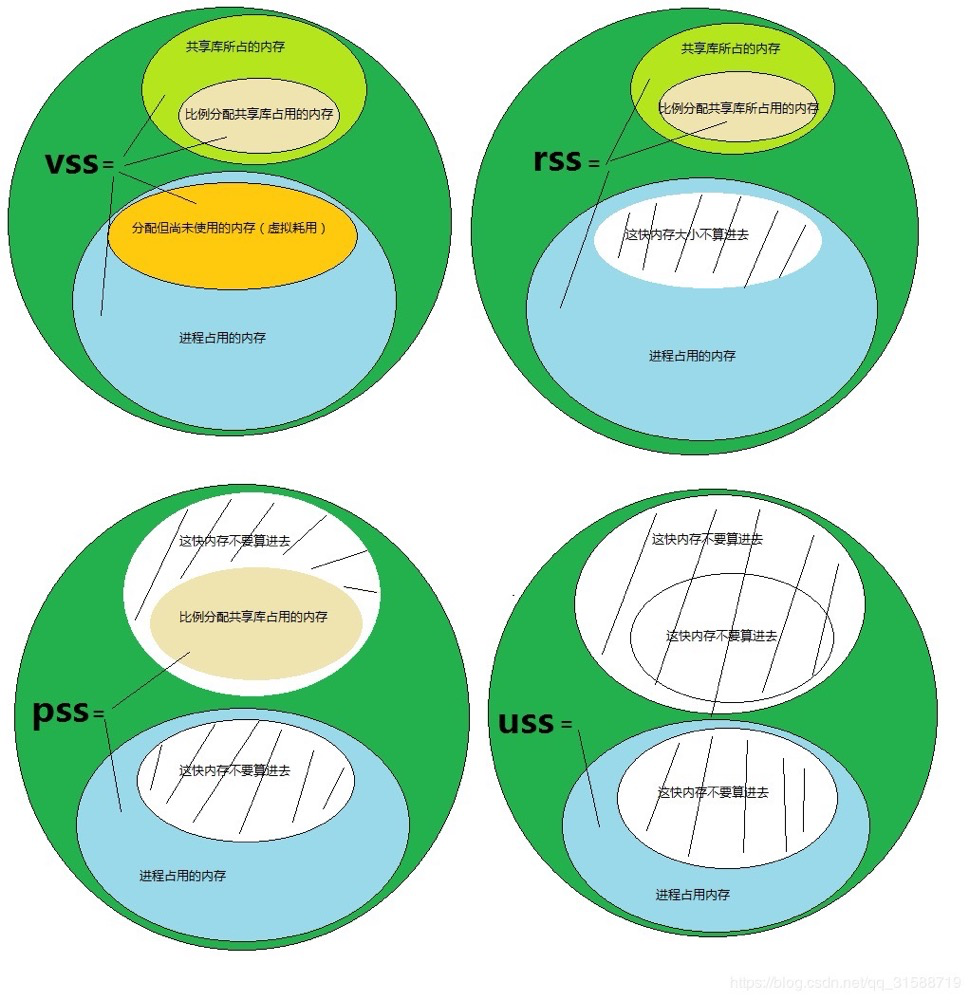
VSS/RSS/PSS/USS
When viewing the memory occupied by a process, there are commonly four forms: VSS/RSS/PSS/USS, mainly differing in memory calculation methodology.
 (https://cloud.tencent.com/developer/article/1683708)
- VSS (Virtual Set Size) is just a virtual space size, with little significance for actual memory usage.
- RSS (Resident Set Size) is used for calculating the total memory occupied by a process, including shared memory size occupied by shared libraries. For example, if private memory size is N and shared memory size is M, then RSS = N + M. This can be misleading, because for large shared libraries like libc, shared by many processes, counting it all against one process is not scientific.
- PSS (Proportional Set Size) is the actual physical memory occupied by a single process when running, including proportionally allocated shared library memory. If a shared library is used by N processes, the size proportionally allocated to PSS is 1/N. PSS calculates process memory more accurately, including exclusive memory plus the shared portion.
- USS (Unique Set Size) is the physical memory exclusively occupied by a process, not including shared memory.
/proc/[pid]/maps
/proc/[pid]/maps can view the user space memory mappings of the process’s virtual memory.
[pg@lzl 2345]$ cat maps
StartAddr-EndAddr  Perms Offset Dev   Inode   Filename
00400000-00bae000 r-xp 00000000 fd:00 1093852 /pg/pg15.3/bin/postgres ---text segment
00dad000-00dc3000 rw-p 007ad000 fd:00 1093852 /pg/pg15.3/bin/postgres
00dc3000-00df5000 rw-p 00000000 00:00 0
00f1e000-00f60000 rw-p 00000000 00:00 0                       [heap]         ---heap area
33a6000000-33a6022000 r-xp 00000000 fd:00 1976006             /lib64/ld-2.17.so
...
7fbe2ae09000-7fbe2ae0a000 rw-p 0000c000 fd:00 1975966         /lib64/libnss_files-2.17.so
7fbe2ae1b000-7fbe33ca7000 rw-s 00000000 00:04 12556           /dev/zero (deleted)
7fbe33ca7000-7fbe39b38000 r--p 00000000 fd:00 1181300         /usr/lib/locale/locale-archive
7fbe39b38000-7fbe39b3d000 rw-p 00000000 00:00 0
7fbe39b46000-7fbe39b4d000 rw-s 00000000 00:10 12559           /dev/shm/PostgreSQL.3661351388
7fbe39b4d000-7fbe39b4e000 rw-s 00000000 00:04 32769           /SYSV0010c0b6 (deleted)
7fbe39b4e000-7fbe39b4f000 rw-p 00000000 00:00 0
7fffe3933000-7fffe3948000 rw-p 00000000 00:00 0               [stack]        --stack area
7fffe397d000-7fffe397e000 r-xp 00000000 00:00 0               [vdso]
ffffffffff600000-ffffffffff601000 r-xp 00000000 00:00 0       [vsyscall]
(1) Start-End Address: The address range of this segment in virtual memory (2) Permissions: Permissions of this segment; r-read, w-write, x-execute, p-private (3) Offset: The offset of this segment mapping in the file (4) Device: The device number of the device where the mapped file resides, corresponding to vm_file->f_dentry->d_inode->i_sb->s_dev. Anonymous mappings have 0. fd is the major device number, 00 is the minor device number. (5) Inode: Corresponds to vm_file->f_dentry->d_inode->i_ino, matches the content displayed by ls -i, anonymous mappings have 0. (6) Mapped File Name: For named mappings, it’s the mapped file name. For anonymous mappings, it’s the role of this memory segment in the process.
Below is an analysis by Wenxin (it actually analyzed it correctly, this is a PostgreSQL postmaster process):

/proc/[pid]/smaps
The /proc/[pid]/smaps file is an extension based on /proc/[pid]/maps, providing more detailed information than the maps file in the same directory. Each VMA has the following series of data:
[pg@lzl 2345]$ cat smaps
00400000-00bae000 r-xp 00000000 fd:00 1093852               /pg/pg15.3/bin/postgres
Size:               7864 kB   --VSS memory
Rss:                 408 kB   --RSS memory
Pss:                 140 kB   --PSS memory
Shared_Clean:        404 kB   --Shared, clean memory size
Shared_Dirty:          0 kB   --Shared, dirty (i.e., modified) memory size
Private_Clean:         4 kB   --Private, clean memory size
Private_Dirty:         0 kB   --Private, dirty memory size
Referenced:          408 kB   --Current page marked as referenced or containing anonymous mappings
Anonymous:             0 kB   --Anonymous pages
AnonHugePages:         0 kB   --Anonymous huge pages
Swap:                  0 kB   --Swapped-out memory size
KernelPageSize:        4 kB   --Kernel page size
MMUPageSize:           4 kB   --Page table page size
...
7fffe3933000-7fffe3948000 rw-p 00000000 00:00 0             [stack]
Size:                 88 kB
Rss:                  16 kB
Pss:                  16 kB
...
Now we know that maps are the process’s memory mapping information, and smaps also includes the memory size of each mapping segment (VSS, RSS, PSS).
You can calculate a process’s memory usage by looking at PSS, RSS, etc. data in process smaps. Note the unit is KB.
Total physical memory usage of all processes:
grep Pss /proc/[1-9]*/smaps | awk '{total+=$2}; END {printf "%d kB\n", total }'PSS memory of a specific process:
cat /proc/90875/smaps |grep Pss |awk '{sum+=$2 };END {print sum/1024}'RSS memory of a specific process:
cat /proc/68729/smaps |grep Rss |awk '{sum+=$2 };END {print sum/1024}'Private memory of a specific process:
cat /proc/90875/smaps|sed '/zero/,/VmFlags/d' |grep Private |awk '{sum+=$2 };END {print sum/1024}'pmap
The pmap command parses the /proc/[pid]/maps and /proc/[pid]/smaps files. It has few parameters; -x means show more information.
[root@lzl ~]# pmap -x 2345
2345:   /pg/pg15.3/bin/postgres -D /pg/1503data
Address           Kbytes     RSS   Dirty Mode   Mapping
0000000000400000    7864     212       0 r-x--  postgres
0000000000dad000      88      12      12 rw---  postgres
0000000000dc3000     200      36      32 rw---    [ anon ]
0000000000f1e000     264      12       8 rw---    [ anon ]
00000033a6000000     136     108       0 r-x--  ld-2.17.so
...
00007fbe2ae09000       4       0       0 rw---  libnss_files-2.17.so
00007fbe2ae1b000  145968    4396    4396 rw-s-  zero (deleted)
00007fbe33ca7000   96836       8       0 r----  locale-archive
00007fbe39b38000      20      16      16 rw---    [ anon ]
00007fbe39b46000      28       4       4 rw-s-  PostgreSQL.3661351388
00007fbe39b4d000       4       0       0 rw-s-    [ shmid=0x8001 ]
00007fbe39b4e000       4       4       4 rw---    [ anon ]
00007fffe3933000      84      16      16 rw---    [ stack ]
00007fffe397d000       4       4       0 r-x--    [ anon ]
ffffffffff600000       4       0       0 r-x--    [ anon ]
----------------  ------  ------  ------
total kB          268896    5532    4540
The pmap output format is similar to /proc/[pid]/maps, with one line per VMA address, but includes VSS and RSS in addition to maps, allowing you to directly see the size used by each region of the process’s virtual memory, helping to quickly determine where the regions with more memory are.
If the [heap] in the address space is too large, it might be a heap memory leak. For another example, if the process address space contains too many VMAs (each line in maps can be understood as a VMA), it’s likely that the application called many mmaps without munmap. Or, continuously observing changes in the address space — if certain entries are continuously growing, there’s likely an issue there.
Analysis Example
From the host’s TOP memory view, a certain PostgreSQL backend process memory appears relatively high. Further analysis of map information is needed:
   PID USER      PR  NI    VIRT    RES    SHR S  %CPU %MEM     TIME+ COMMAND
68729 postgres  20   0 5579004 5.116g 5.114g R  97.4  1.4 128:27.94 postgres: lzl: lzldb lzl 30.78.14.174(58067) DELETE
Check this process’s Rss, Pss, Uss:
cat /proc/68729/smaps |grep Rss |awk '{sum+=$2 };END {print sum/1024}'
5422.67  ---5.4G  Rss
cat /proc/68729/smaps |grep Pss |awk '{sum+=$2 };END {print sum/1024}'
467.957  ---467mb Pss
cat /proc/68729/smaps|sed '/zero/,/VmFlags/d' |grep Private |awk '{sum+=$2 };END {print sum/1024}'
179.605  ---179mb Uss
Rss-Uss=5.3G of shared memory. From Pss-Uss=290mb of proportional shared memory, we can roughly see that this backend is only a small portion of this shared memory proportion.
$ pmap -x 68729
68729:   postgres: pdmp: pdmpdata pdmp 30.78.14.174(46252) DELETE
Address           Kbytes     RSS   Dirty Mode  Mapping
0000000000400000    6084    2444       0 r-x-- postgres
0000000000bf0000       4       4       4 r---- postgres
0000000000bf1000      52      52      52 rw--- postgres
...
00002b7f65bfa000 5441216 5365444 5365444 rw-s- zero (deleted)   --this part takes the most
00002b80b1daa000      48       0       0 r-x-- libnss_files-2.17.so
00002b80b1db6000    2044       0       0 ----- libnss_files-2.17.so
00002b80b1fb5000       4       4       4 r---- libnss_files-2.17.so
00002b80b1fb6000       4       4       4 rw--- libnss_files-2.17.so
00002b80b1fb7000      24       0       0 rw---   [ anon ]
00002b80ba001000     516     516     516 rw---   [ anon ]
00007fffe16f7000     132      88      88 rw---   [ stack ]
00007fffe175b000       8       4       0 r-x--   [ anon ]
ffffffffff600000       4       0       0 r-x--   [ anon ]
Diving deeper into smap analysis, we can directly locate the zero (deleted) part:
$ cat smaps
00400000-009f1000 r-xp 00000000 fd:06 58726481            /paic/postgres/base/9.6.6/bin/postgres
...
2b7f65bfa000-2b80b1daa000 rw-s 00000000 00:04 72254       /dev/zero (deleted)
Size:            5441216 kB
Rss:             5365444 kB
Pss:              264618 kB
Shared_Clean:          0 kB
Shared_Dirty:    5365444 kB   --shared dirty data
Private_Clean:         0 kB
Private_Dirty:         0 kB
Referenced:      5364764 kB
Anonymous:             0 kB
AnonHugePages:         0 kB
Swap:                  0 kB
KernelPageSize:        4 kB
MMUPageSize:           4 kB
Locked:                0 kB
VmFlags: rd wr sh mr mw me ms sd
From the above analysis, we can conclude: this is a PostgreSQL private process that has modified a large amount of data without flushing dirty pages. Its own private memory is not much; most is occupied in shared memory. This is likely a transaction in PostgreSQL that has modified a lot of data but hasn’t committed yet.
Additionally, /dev/zero (deleted) is explained in proc(5) — Linux manual page:
Although these entries are present for memory regions that were mapped with the MAP_FILE flag, the way anonymous shared memory (regions created with the MAP_ANON | MAP_SHARED flags) is implemented in Linux means that such regions also appear on this directory. Here is an example where the target file is the deleted /dev/zero one:
              lrw-------. 1 root root 64 Apr 16 21:33
                          7fc075d2f000-7fc075e6f000 -> /dev/zero (deleted)
“Unofficial translation”: Anonymous pages and shared pages are represented by /dev/zero (deleted).
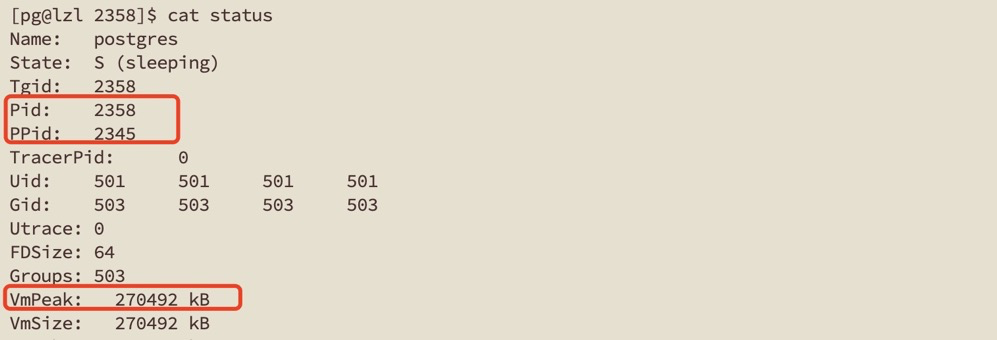
/proc/[pid]/status#
status can view process state information, including some memory information.
[root@lzl 2345]#  cat status
Name:   postgres         ---the command running this thread
State:  S (sleeping)     ---process state
Tgid:   2345             ---Thread group ID (i.e., Process ID)
Pid:    2345             ---Thread ID
PPid:   1                ---PID of parent process.
...
VmPeak:   268964 kB      ---virtual memory peak
VmSize:   268896 kB      ---virtual memory current
VmLck:         0 kB
VmHWM:     13400 kB      ---RSS peak
VmRSS:      5532 kB      ---RSS current
VmData:      528 kB      ---data segment
VmStk:        88 kB      ---stack segment
VmExe:      7864 kB      ---text segment
VmLib:      3100 kB      ---shared library code segment
VmPTE:       136 kB      ---Page table entries
VmSwap:      308 kB      ---swap size
Threads:        1        ---number of threads in this process
....
Compared to maps, status has no mapping information. The memory data is more summarized, allowing for a more intuitive view of the size occupied by each segment of virtual memory.
View processes with the most SWAP usage:
for file in /proc/*/status ; do awk '/VmSwap|Name|^Pid/{printf $2 " " $3}END{ print ""}' $file; done | sort -k 3 -n -r | headcgroup memory#
cgroup memory control is now very common. Some host parameters need to be set in cgroup. Memory settings and monitoring information are under /sys/fs/cgroup/memory/.
cginfo to view CGROUP memory allocation and usage: /opt/cgtools/cginfo -t perf -s mem
cginfo -t perf -s mem
==================== Cgroup Performance: memory ====================
DB_TYPE     INSTANCE_NAME     MEM_OOM     MEM_FILE_GB    MEM_MAP_GB     MEM_USED_GB    MEM_ALLO_GB    ALLO_RATE      MEM_GLOB_GB    GLOB_RATE
-------     -------------     -------     -----------    ----------     -----------    -----------    ---------      -----------    ---------
postgres    LZLDB              0           154.3          0.0            4.2            160.0          2.6%           375            1.1%
View relatively detailed CGROUP memory usage status: /sys/fs/cgroup/memory/[group]/memory.stat
$ cat memory.stat
...
total_cache 167791534080
total_rss 4006932480
total_rss_huge 0
total_mapped_file 11747328
total_swap 0
total_pgpgin 792754417976
total_pgpgout 792712474991
total_pgfault 477971874868
total_pgmajfault 97318
total_inactive_anon 1610874880
total_active_anon 2408255488
total_inactive_file 73446166528
total_active_file 94332768256
total_unevictable 0smem#
smem is a powerful tool for displaying memory usage. It reads information from smaps, meminfo, etc. under /proc and outputs summaries. smem can output overall and specific map memory conditions, which is very intuitive and can be analyzed from different dimensions. Overall, it’s a very useful tool for analyzing memory usage.
The repo can be downloaded directly. Basically, just extract and use it. For more usage, refer to smem memory reporting tool. Below are just simple examples:
View system memory usage -w:
[root@lzl ~]# smem -w -k
Area                           Used      Cache   Noncache
firmware/hardware                 0          0          0
kernel image                      0          0          0
kernel dynamic memory        183.9M      84.0M      99.9M
userspace memory             112.3M      62.2M      50.1M
free memory                  700.3M     700.3M          0
View memory consumption per user -u:
[root@lzl ~]# smem -s pss -urk
User     Count     Swap      USS      PSS      RSS
oracle      25    85.2M    30.8M    95.7M   383.0M
root        93   112.4M    38.5M    42.3M    86.2M
pg          12     5.9M     1.6M     2.5M     5.9M
mysql        1   169.7M     1.7M     1.7M     2.0M
View memory consumption for a specific user -U:
[root@lzl ~]# smem -U pg -k
  PID User     Command                         Swap      USS      PSS      RSS
 2345 pg       /pg/pg15.3/bin/postgres -D    364.0K   124.0K   134.0K   228.0K
 2352 pg       postgres: logical replicati   636.0K   144.0K   161.0K   196.0K
 ...
Filter a specific process -P (PROCESSFILTER, not pid):
[root@lzl ~]# smem -P postgres -p
  PID User     Command                         Swap      USS      PSS      RSS
 2346 pg       /pg/pg16.0/bin/postgres -D     0.01%    0.01%    0.01%    0.01%
 2350 pg       postgres: walwriter            0.01%    0.01%    0.01%    0.01%
 ...
View process mapping and memory usage -m:
[root@lzl ~]# smem -P postgres -mpr -s pss
Map                                       PIDs   AVGPSS      PSS
<anonymous>                                 13    0.02%    0.24%
[heap]                                       3    0.07%    0.20%
/usr/lib64/libpython2.6.so.1.0               1    0.11%    0.11%
/pg/pg15.3/bin/postgres                      6    0.01%    0.06%
/pg/pg16.0/bin/postgres                      6    0.01%    0.06%
/dev/zero                                   12    0.00%    0.03%
[stack]                                     13    0.00%    0.02%
...
smem is very intuitive for viewing process USS\PSS\RSS. However, there is one issue: smem cannot filter by pid, only by username or PROCESSFILTER. When a host has multiple database instances deployed, filtering by parent PID or child PID is not very friendly.
top#
top can display system running status in real time. top can be quite fancy in its usage. Running top directly can also display a lot of information.
Sorting in top:
command   sorted-field                  supported
M         %MEM                          Yes
N         PID                           Yes
P         %CPU                          Yes
T         TIME+                         Yes
You can use %MEM to sort processes with higher memory usage. %MEM represents the RES memory percentage.
top - 23:38:01 up 3 days, 22:32,  2 users,  load average: 1.12, 1.42, 1.09
Tasks: 198 total,  13 running, 183 sleeping,   0 stopped,   2 zombie
Cpu(s):  0.0%us,  0.3%sy,  0.0%ni, 99.7%id,  0.0%wa,  0.0%hi,  0.0%si,  0.0%st
Mem:   1020348k total,   325848k used,   694500k free,     1352k buffers
Swap:  4128760k total,   635872k used,  3492888k free,   150288k cached

  PID USER      PR  NI  VIRT  RES  SHR S %CPU %MEM    TIME+  COMMAND
18537 oracle    20   0  636m  24m  21m S  0.0  2.4   0:05.41 oracle
18533 oracle    20   0  638m  24m  21m S  0.0  2.4   0:02.01 oracle
...
18509 oracle    20   0  634m 4384 4036 S  0.0  0.4   0:01.93 oracle
 2639 root      20   0  729m 4052 1444 S  0.0  0.4   8:45.32 nautilus
Memory-related interpretation:
Line 4: Memory usage information: physical memory amount, used memory, free memory, buffer memory Line 5: Swap partition information: available swap total, used swap total, free swap total, kernel cached amount
Line 6 (memory-related):
- VIRT: VSS
- RES: RSS (likely), anything occupying physical memory
- SHR: Shared Memory Size. It will include shared anonymous pages and shared file-backed pages
- %MEM: RSS percentage, a task’s currently resident share of available physical memory.
Additionally, don’t forget to look at the process status when checking memory.
S (example column 8) Process Status:
- D = uninterruptible sleep. Indicates the process is waiting for an external event to complete, such as disk I/O operations or network requests. Usually, D processes cannot be directly terminated.
- I = idle
- R = running
- S = sleeping
- T = stopped by job control signal
- t = stopped by debugger during trace
- Z = zombie
The top command can see the host’s memory summary information. Process memory usage information includes RSS and SHR. A rough calculation of RES-SHR=USS can also calculate the private memory usage size. Additionally, you can see process status, so top -p to view basic memory information for a specific process is very useful.
free#
free displays the host’s swap, total and remaining memory, all parsed from /proc/meminfo.
user@ubuntu:~$ free

          total    used      free   shared   buff/cache  available
Mem:    8029356  794336   6297928   183384       937092    6816804
Swap: 0 0 0- total: Total usable memory (MemTotal and SwapTotal in /proc/meminfo). This includes the physical and swap memory minus a few reserved bits and kernel binary code.
- used: Used or unavailable memory (calculated as total - available)
- free: Unused memory (MemFree and SwapFree in /proc/meminfo) shared Memory used (mostly) by tmpfs (Shmem in /proc/meminfo)
- buffers: Memory used by kernel buffers (Buffers in /proc/meminfo)
- cache: Memory used by the page cache and slabs (Cached and SReclaimable in /proc/meminfo). Not just pagecache, but also SReclaimable slab!
- buff/cache: Sum of buffers and cache
- available: cache includes pagecache and SReclaimable, free includes mem free and swap free; while available includes pagecache and memory about to be reclaimed. Indicates available memory, but their calculation methods differ. In practical applications, due to cache existence, available is usually larger than free.
Page Cache: Page cache is primarily used as a cache for file data on the file system, especially when processes have read/write operations on files.
Buffer Cache: Buffer cache is primarily designed for caching blocks when the system reads/writes block devices.
ps aux#
The biggest advantage of ps is analyzing process status (including memory) from the process perspective. Processes with [ ] flags in the COMMAND are kernel processes.
[pg@lzl ~]$ ps  aux|head -1;ps aux|grep postgres
USER       PID %CPU %MEM    VSZ   RSS TTY      STAT START   TIME COMMAND
pg        2345  0.0  0.0 268896   236 ?        Ss   Jan01   0:03 /pg/pg15.3/bin/postgres -D /pg/1503data
pg        2353  0.0  0.0 269040   196 ?        Ss   Jan01   0:00 postgres: checkpointer
pg        2354  0.0  0.0 269032   160 ?        Ss   Jan01   0:02 postgres: background writer
pg        2356  0.0  0.0 269032   116 ?        Ss   Jan01   0:01 postgres: walwriter
pg        2357  0.0  0.0 270508   824 ?        Ss   Jan01   0:02 postgres: autovacuum launcher
pg        2358  0.0  0.0 270492   620 ?        Ss   Jan01   0:00 postgres: logical replication launcher
pg       29818  0.0  0.0 103372   868 pts/0    S+   09:16   0:00 grep postgres
VSZ and RSS units are KB. Memory information is limited; VSZ has little value, RSS can be referenced, but there’s no PSS or USS type information, so not much can be analyzed.
ipcs#
ipcs -m is a command for querying IPC (Interprocess Communication) shared memory resources. It’s quite useful when analyzing shared memory.
[pg@lzl ~]$ ipcs -m

------ Shared Memory Segments --------
key        shmid      owner      perms      bytes      nattch     status
0x0010c0b6 32769 pg 600 56 6 - Shared memory key value
- Shared memory ID (shmid)
- User who created this shared memory
- Permissions (perms)
- Created size (bytes)
- Number of processes attached to this shared memory (nattach)
- Shared memory status
When connecting a session to PostgreSQL, one more backend process appears:
------ Shared Memory Segments --------
key        shmid      owner      perms      bytes      nattch     status
0x0010c0b6 32769      pg         600        56         7
nattch+1, indicating that the private backend process also shares a portion of the PG shared memory. At this point, the following diagram is understood more deeply:
 (http://gauss.ececs.uc.edu/Courses/c4029/code/memory/virtual.pdf)
vmstat#
vmstat is an abbreviation for Virtual Memory Statistics, and can monitor the operating system’s virtual memory, processes, and CPU activity. It provides statistics on the overall system situation; the shortcoming is that it cannot perform in-depth analysis of a specific process.
Useful parameter explanations:
vmstat [options] [delay [count]]
OPTIONS:
-a  Display active and inactive memory
-m  Display slabinfo
-s  Display memory-related statistics and various system activity counts
-t  Append timestamp to each line
-w  Wide output mode. Without w, the output is narrow, reducing alignment issues
-bash-4.1$ vmstat -w 1 3
procs -------------------memory------------------ ---swap-- -----io---- --system-- -----cpu-------
r b swpd free buff cache si so bi bo in cs us sy id wa st
0 1 661652 763348 324 76100 15 12 54 21 18 45 0 0 79 21 0
2 1 661652 763340 304 75764 0 0 0 32 12 84 0 1 0 99 0
41 1 661652 760744 244 78300 228 0 3216 0 265 442 0 0 0 100 0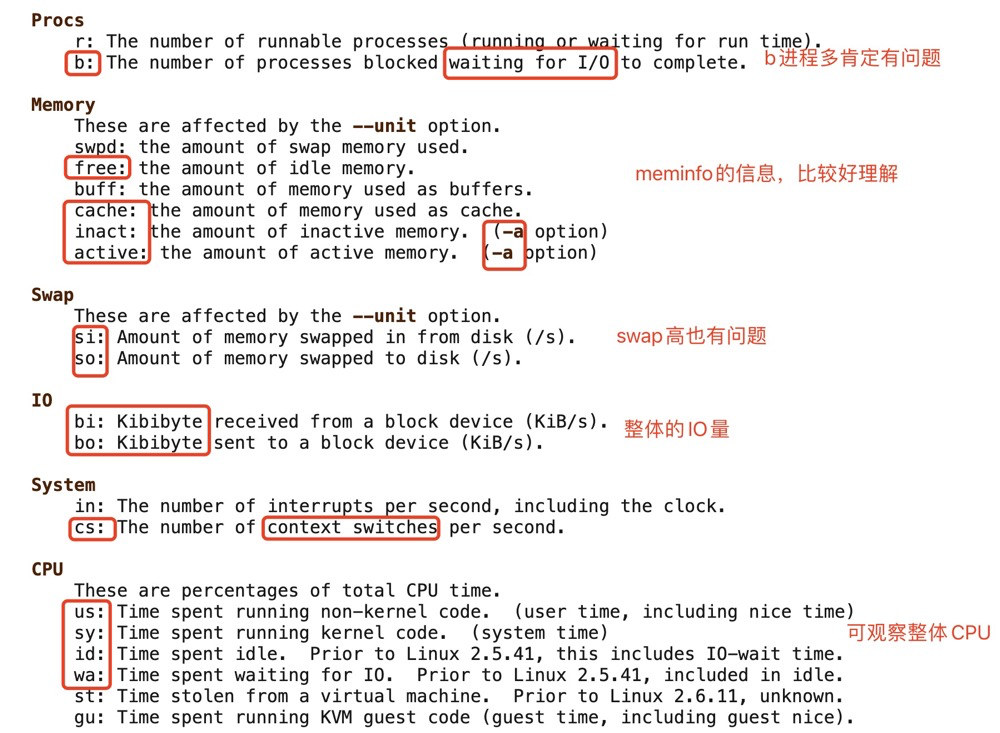
pidstat#
pidstat is a command from the sysstat tool, used to monitor all or specified processes’ CPU, memory, threads, device IO, and other system resource usage.
Useful parameter explanations:
pidstat OPTIONS interval [ count ]
-d :Report I/O statistics
-u :Report CPU utilization
-r :Report page faults and memory utilization
-w :Report task switching activity
-p :pid[,...]
-l :Display the process command name and all its arguments.
View memory status of a specific process:
-bash-4.1$ pidstat -r -l  -p 2345
Linux 2.6.32-431.el6.x86_64 (lzl)       01/06/2024      _x86_64_        (1 CPU)

02:48:32 PM       PID  minflt/s  majflt/s     VSZ    RSS   %MEM  Command
02:48:32 PM      2345      0.23      0.00  268896    240   0.02  /pg/pg15.3/bin/postgres -D /pg/1503data
Various indicators are relatively easy to understand. VSZ, RSS — tired of talking about them.
- minflt/s: Abbreviation for “minor page faults”, indicating the number of “minor page faults” that occur per second. A page fault occurs when a program tries to access a page that is not in physical memory. If the page is indeed in the swap area on disk, this is a minor page fault.
- majflt/s: Abbreviation for “major page faults”, indicating the number of “major page faults” that occur per second. Unlike minor page faults, major page faults occur when a program tries to access a page that is not in physical memory and is also not in the swap area on disk.
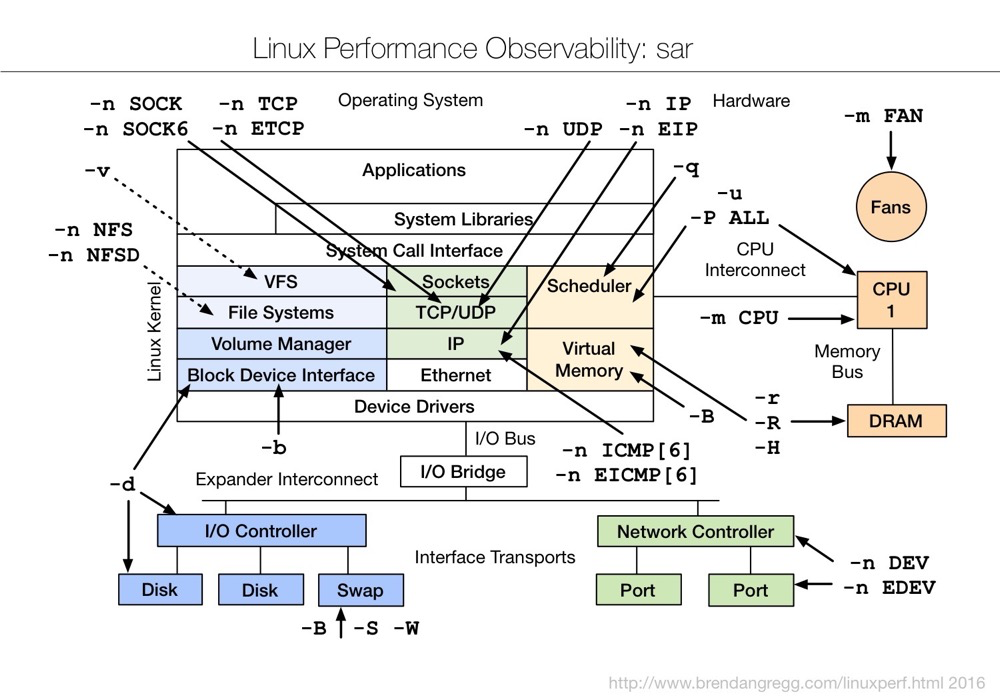
sar#
sar (System Activity Reporter) is currently one of the most comprehensive system performance analysis tools on Linux. It can report on various aspects of system activity, including: file read/write status, system call usage, disk I/O, CPU efficiency, memory usage, process activity, and IPC-related activity. The SAR tool is part of the sysstat software package.
 (https://www.brendangregg.com/Perf/linux_observability_sar.png)
sar is very powerful. The man parameter introduction alone has over 1k lines. This article cannot possibly explain everything (being lazy).
Memory-related parameters:
sar OPTIONS interval [ count ]
-B :Report paging statistics
-r :Report memory utilization statistics
-W :Report swapping statistics.
-H :Report hugepages utilization statistics
-s [ start_time ] ] [ -e [ end_time ]
Example: sar view memory utilization
sar -r 1 3
- kbmemfree: This value is basically consistent with the free value in the free command, so it does not include buffer and cache space
- kbmemused: This value is basically consistent with the used value in the free command, so it includes buffer and cache space
- %memused: This value is kbmemused as a percentage of total memory (excluding swap)
- kbbuffers: buffer in the free command
- kbcached: cache in the free command
- kbcommit: Memory needed to guarantee the current system, i.e., memory needed to ensure no overflow (RAM + swap)
- %commit: This value is kbcommit as a percentage of total memory (including swap)
Example: sar view memory page status
sar -B 1 3
- pgpgin/s: Kilobytes paged in from disk or SWAP to memory per second
- pgpgout/s: Kilobytes paged out from memory to disk or SWAP per second
- fault/s: Number of page faults per second, i.e., sum of major and minor faults
- majflt/s: Number of major faults per second
- pgfree/s: Number of pages placed on the free queue per second
- pgscank/s: Number of pages scanned by kswapd per second
- pgscand/s: Number of pages directly scanned per second
- pgsteal/s: Number of pages reclaimed from cache to meet memory needs per second
- %vmeff: Pages stolen (pgsteal) as a percentage of total scanned pages (pgscank + pgscand) per second
Example: sar view swap information
sar -W 1 3
Report explanation:
- pswpin/s: Number of swap pages swapped in per second
- pswpout/s: Number of swap pages swapped out per second
Example: sar view historical memory information
sar -B -s "08:00:00" -e "10:00:00"
#Without -e, it shows information from the start time to now
$ sar -B -s "08:00:00"
09:45:01 PM  pgpgin/s pgpgout/s   fault/s  majflt/s  pgfree/s pgscank/s pgscand/s pgsteal/s    %vmeff
09:46:01 PM 414429.37 395024.08 179478.63      0.07 352922.62  12003.78   4266.52  16269.42     99.99
09:47:01 PM 879907.08 337948.43 157970.97      0.02 402290.21      0.00      0.00      0.00      0.00
09:48:01 PM 772977.43 507343.30 150255.50      0.05 466742.08      0.00   5821.28   5821.27    100.00
Above, pgscank represents the speed at which the kswapd process intervenes in memory reclamation, and pgscand represents the speed of direct memory reclamation.
gcore#
gcore is part of gdb and can generate a core dump file for a process.
Example: dump a PostgreSQL backend process:
[root@lzl ~] ps -ef|grep 8296
pg        8296  2345  0 09:41 ?        00:00:00 postgres: pg lzldb [local] idle
[root@lzl ~] cat /proc/8296/smaps |grep Pss |awk '{sum+=$2 };END {print sum/1024}'
0.351562
[root@lzl ~] cat /proc/8296/smaps |grep Rss |awk '{sum+=$2 };END {print sum/1024}'
0.445312
[root@lzl ~] cat /proc/8296/smaps|sed '/zero/,/VmFlags/d' |grep Private |awk '{sum+=$2 };END {print sum/1024}'
0.0078125
Process 8296’s USS is only 7.8 KB, RSS 445 KB. Dump memory:
gcore -o /tmp/dump 8296Dumping takes some time, and the dumped file is relatively large, and it will hang the process.
[root@lzl 8296]# ls -lh /tmp/dump.8296
-rw-r--r-- 1 root root 252M Jan 7 10:59 /tmp/dump.8296gdb#
gdb can view specific locations and content in memory.
Example: view PostgreSQL backend cached data:
- Open a new session to query a partitioned table, keeping the session open:
[pg@lzl ~]$ psql
psql (15.3)
Type "help" for help.

postgres=> \c lzldb
You are now connected to database "lzldb" as user "pg".
lzldb=> select * from lzlpartition limit 1;
 appl_no | is_deleted | date_created | date_updated
---------+------------+--------------+--------------
(0 rows)- Use pmap, smaps to view process memory usage and find the memory segment to dump:
[root@lzl 13393]# pmap -x 13393
13393:   postgres: pg lzldb [local] idle
Address           Kbytes     RSS   Dirty Mode   Mapping
0000000000400000    7864    1204       0 r-x--  postgres
..
00007fbe2ae1b000  145968    2164     176 rw-s-  zero (deleted)  ---RSS takes the most here
00007fbe33ca7000   96836       0       0 r----  locale-archive
00007fbe39b38000      20       0       0 rw---    [ anon ]
00007fbe39b46000      28       0       0 rw-s-  PostgreSQL.3661351388
00007fbe39b4d000       4       0       0 rw-s-    [ shmid=0x8001 ]
00007fbe39b4e000       4       0       0 rw---    [ anon ]
00007fffe3933000      84      36       0 rw---    [ stack ]
00007fffe397d000       4       4       0 r-x--    [ anon ]
ffffffffff600000       4       0       0 r-x--    [ anon ]

[root@lzl 13393]# cat /proc/13393/smaps |grep -A 13 zero
7fbe2ae1b000-7fbe33ca7000 rw-s 00000000 00:04 12556          /dev/zero (deleted)
Size:             145968 kB
Rss:                2164 kB
Pss:                2164 kB
Shared_Clean:          0 kB
Shared_Dirty:          0 kB
Private_Clean:      1988 kB
Private_Dirty:       176 kB
Referenced:         2164 kB
Anonymous:             0 kB
AnonHugePages:         0 kB
Swap:                  0 kB
KernelPageSize:        4 kB
MMUPageSize: 4 kB- gdb dump memory:
The starting position for dumping memory is the vm address in smaps + 0x:
[pg@lzl tmp]$ gdb
(gdb) attach 13393
(gdb) dump memory /tmp/delete.dump 0x7fbe2ae1b000 0x7fbe33ca7000- View the dump file:
You can simply view it through strings:
[root@lzl 13393]#  strings /tmp/delete.dump|grep lzl|sort|uniq
...
 @lzlpartition_202301
lzlpartition_202301
lzlpartition_202301_appl_no_idx
lzlpartition_202301_date_created_idx
...
lzlpartition_202306
lzlpartition_202306_appl_no_idx
lzlpartition_202306_date_created_idx
 @lzlpartition_attach
lzlpartition_attach
 @nk_lzlpartition
nk_lzlpartition
select * from lzlpartition limit 1;
As long as the session queries a partitioned table, all partition and index metadata is cached in the backend process.
Note:
- gdb attach [pid] will hang the process; do not execute casually
- The dump file size equals VSS, generally much larger than RSS/PSS/USS
Memory Summary#
References#
Easily Break Through File I/O Bottlenecks: Memory-Mapped mmap Technology https://blog.51cto.com/u_15481245/6582927
Step by Step with Diagrams: Deep Understanding of Linux Physical Memory Management https://cloud.tencent.com/developer/article/2352771?areaId=106001
Systematically Learning Memory Management from a DBA’s Perspective https://mp.weixin.qq.com/s/CybzGP44dVWQN5hfFrVx7A
https://linux2me.wordpress.com/2017/09/15/linux-introduction-to-memory-management/
Memory management in Linux https://www.slideshare.net/raghusiddarth/memory-management-in-linux-11551521?from_search=2
Linux Performance Tunning Memory https://www.slideshare.net/shayc1/linux-performance-tunning-memory?from_search=4
How to Learn the Linux Kernel (Memory Chapter) https://mp.weixin.qq.com/s/lKKHH1MMiZbnIbDQt3-IAQ
https://courses.engr.illinois.edu/cs241/sp2014/lecture/09-VirtualMemory_II_sol.pdf
Linux Process Virtual Address Space https://maodanp.github.io/2019/06/02/linux-virtual-space/
Red Hat Official Documentation https://access.redhat.com/documentation/en-us/red_hat_enterprise_linux/7/html/virtualization_tuning_and_optimization_guide/chap-virtualization_tuning_optimization_guide-numa
Data Processing on Modern Hardware https://db.in.tum.de/teaching/ss21/dataprocessingonmodernhardware/MH_8.pdf?lang=de
Chapter 2 Describing Physical Memory https://www.kernel.org/doc/gorman/html/understand/understand005.html
Various command man pages
Linux Forced Memory Reclamation, Linux Memory Source Code Analysis - Memory Reclamation (Overall Process) https://blog.csdn.net/weixin_35094083/article/details/116688112
<Memory compaction https://lwn.net/Articles/368869/>
Memory Journey — How to Improve CMA Utilization? https://ost.51cto.com/posts/10815
The implementations of anti pages fragmentation in Linux kernel https://teawater.github.io/presentation/antif.pdf
T H E /proc F I L E S Y S T E M https://www.kernel.org/doc/Documentation/filesystems/proc.txt
The /proc/meminfo File in Linux https://www.baeldung.com/linux/proc-meminfo
the proc filesystem https://access.redhat.com/documentation/en-us/red_hat_enterprise_linux/6/html/deployment_guide/s2-proc-meminfo
Introduction and Usage of Linux /proc/{pid}/maps (Locating Memory Leaks) https://blog.csdn.net/mijichui2153/article/details/123934531
CPU and Memory Usage in Linux top Command https://blog.csdn.net/weixin_45030965/article/details/127693042
smem memory reporting tool https://www.selenic.com/smem/
Linux performance optimization https://feiyang233.club/post/linux/
gdb onlinedocs https://sourceware.org/gdb/current/onlinedocs/gdb
Linux_Core_Dumps https://averageradical.github.io/Linux_Core_Dumps.pdf